If you prefer to see a step-by-step 7 min video, you can play this video:
To copy a Looker Studio template follow these steps:
Go to the main menu in Porter Metrics and open the Template Gallery
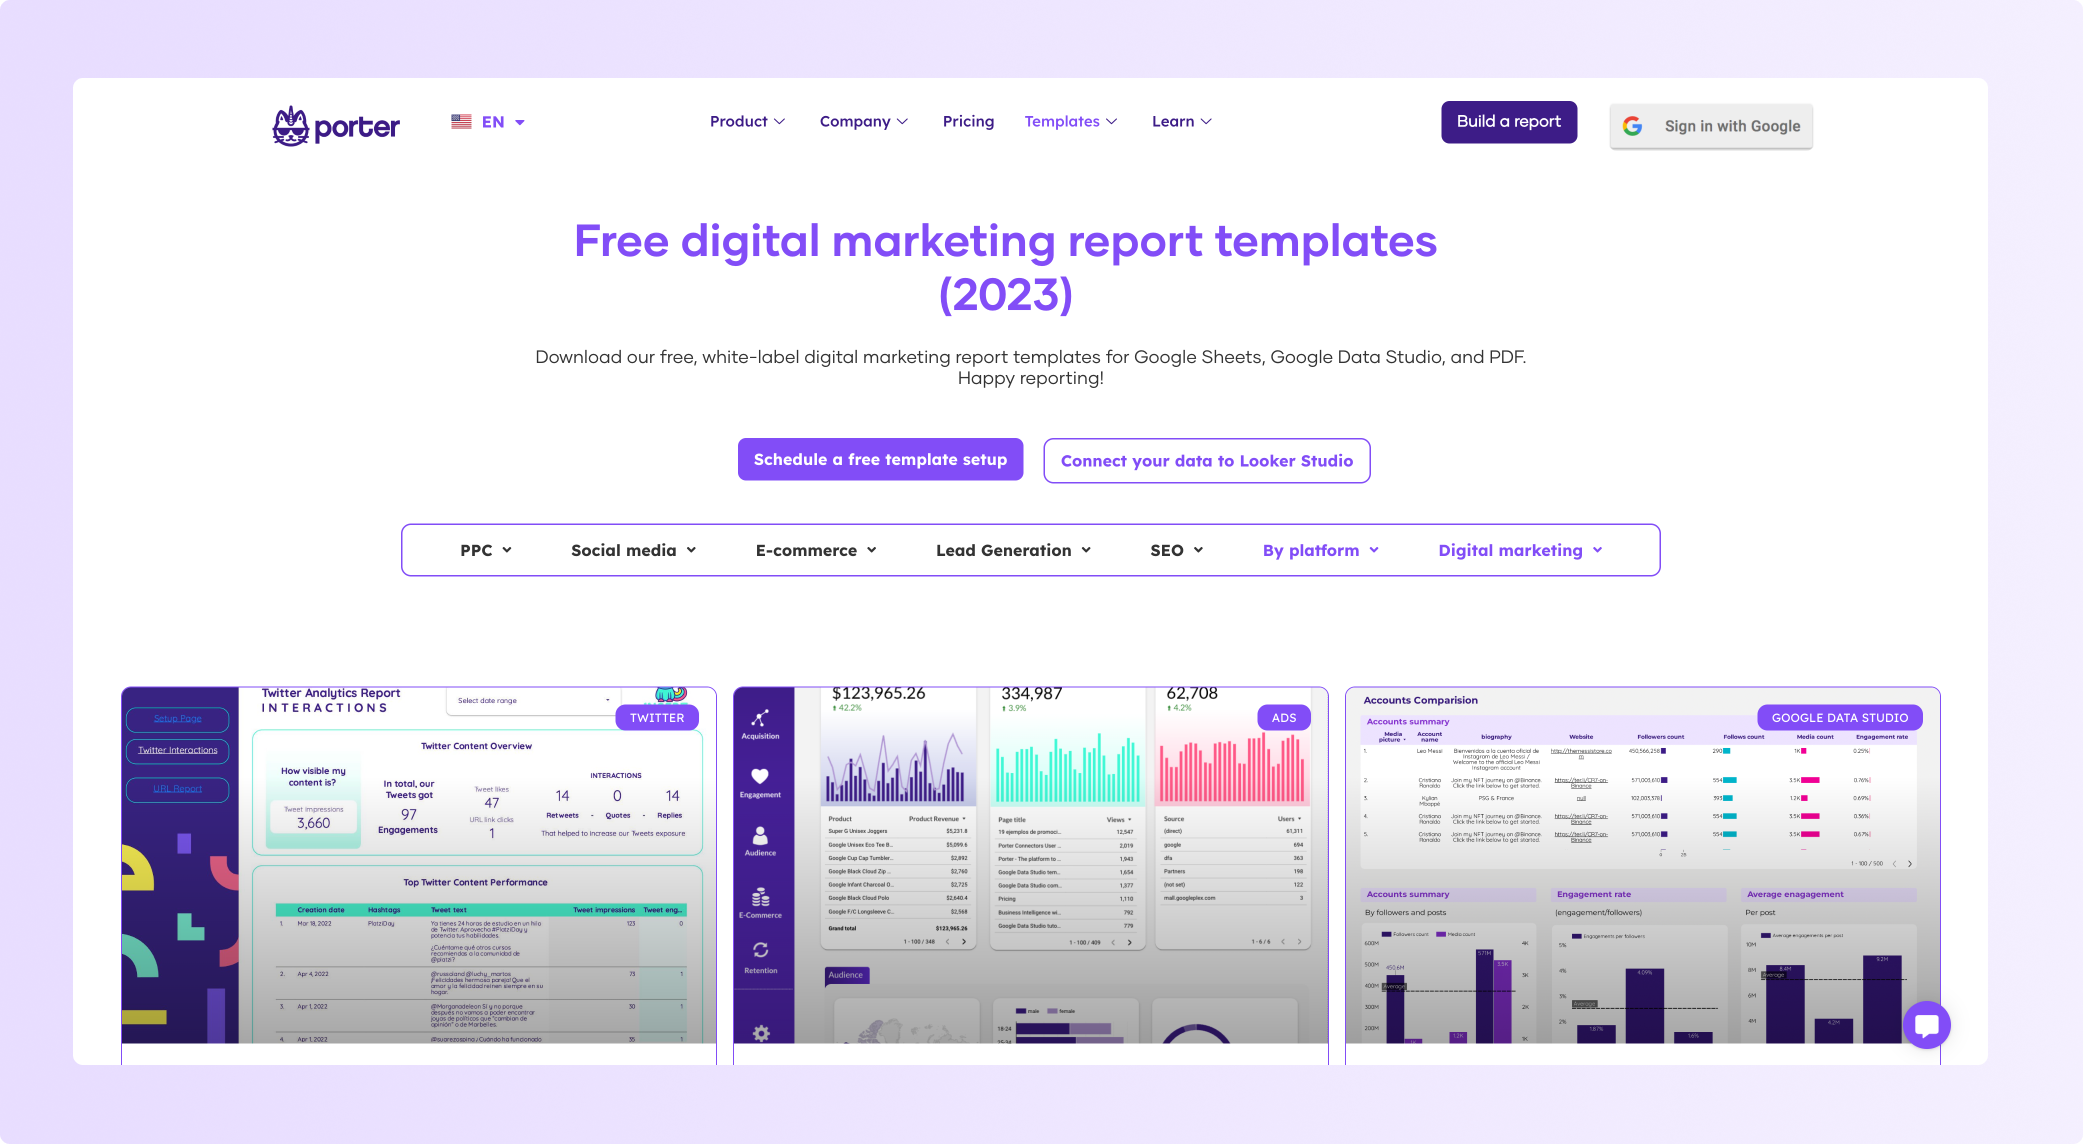
Browse through the over 80 templates made with different data source connectors such as Facebook Ads, LinkedIn Pages, Instagram Insights and Google My Business.
For this example, I will select the LinkedIn Pages template under the Social Media templates section
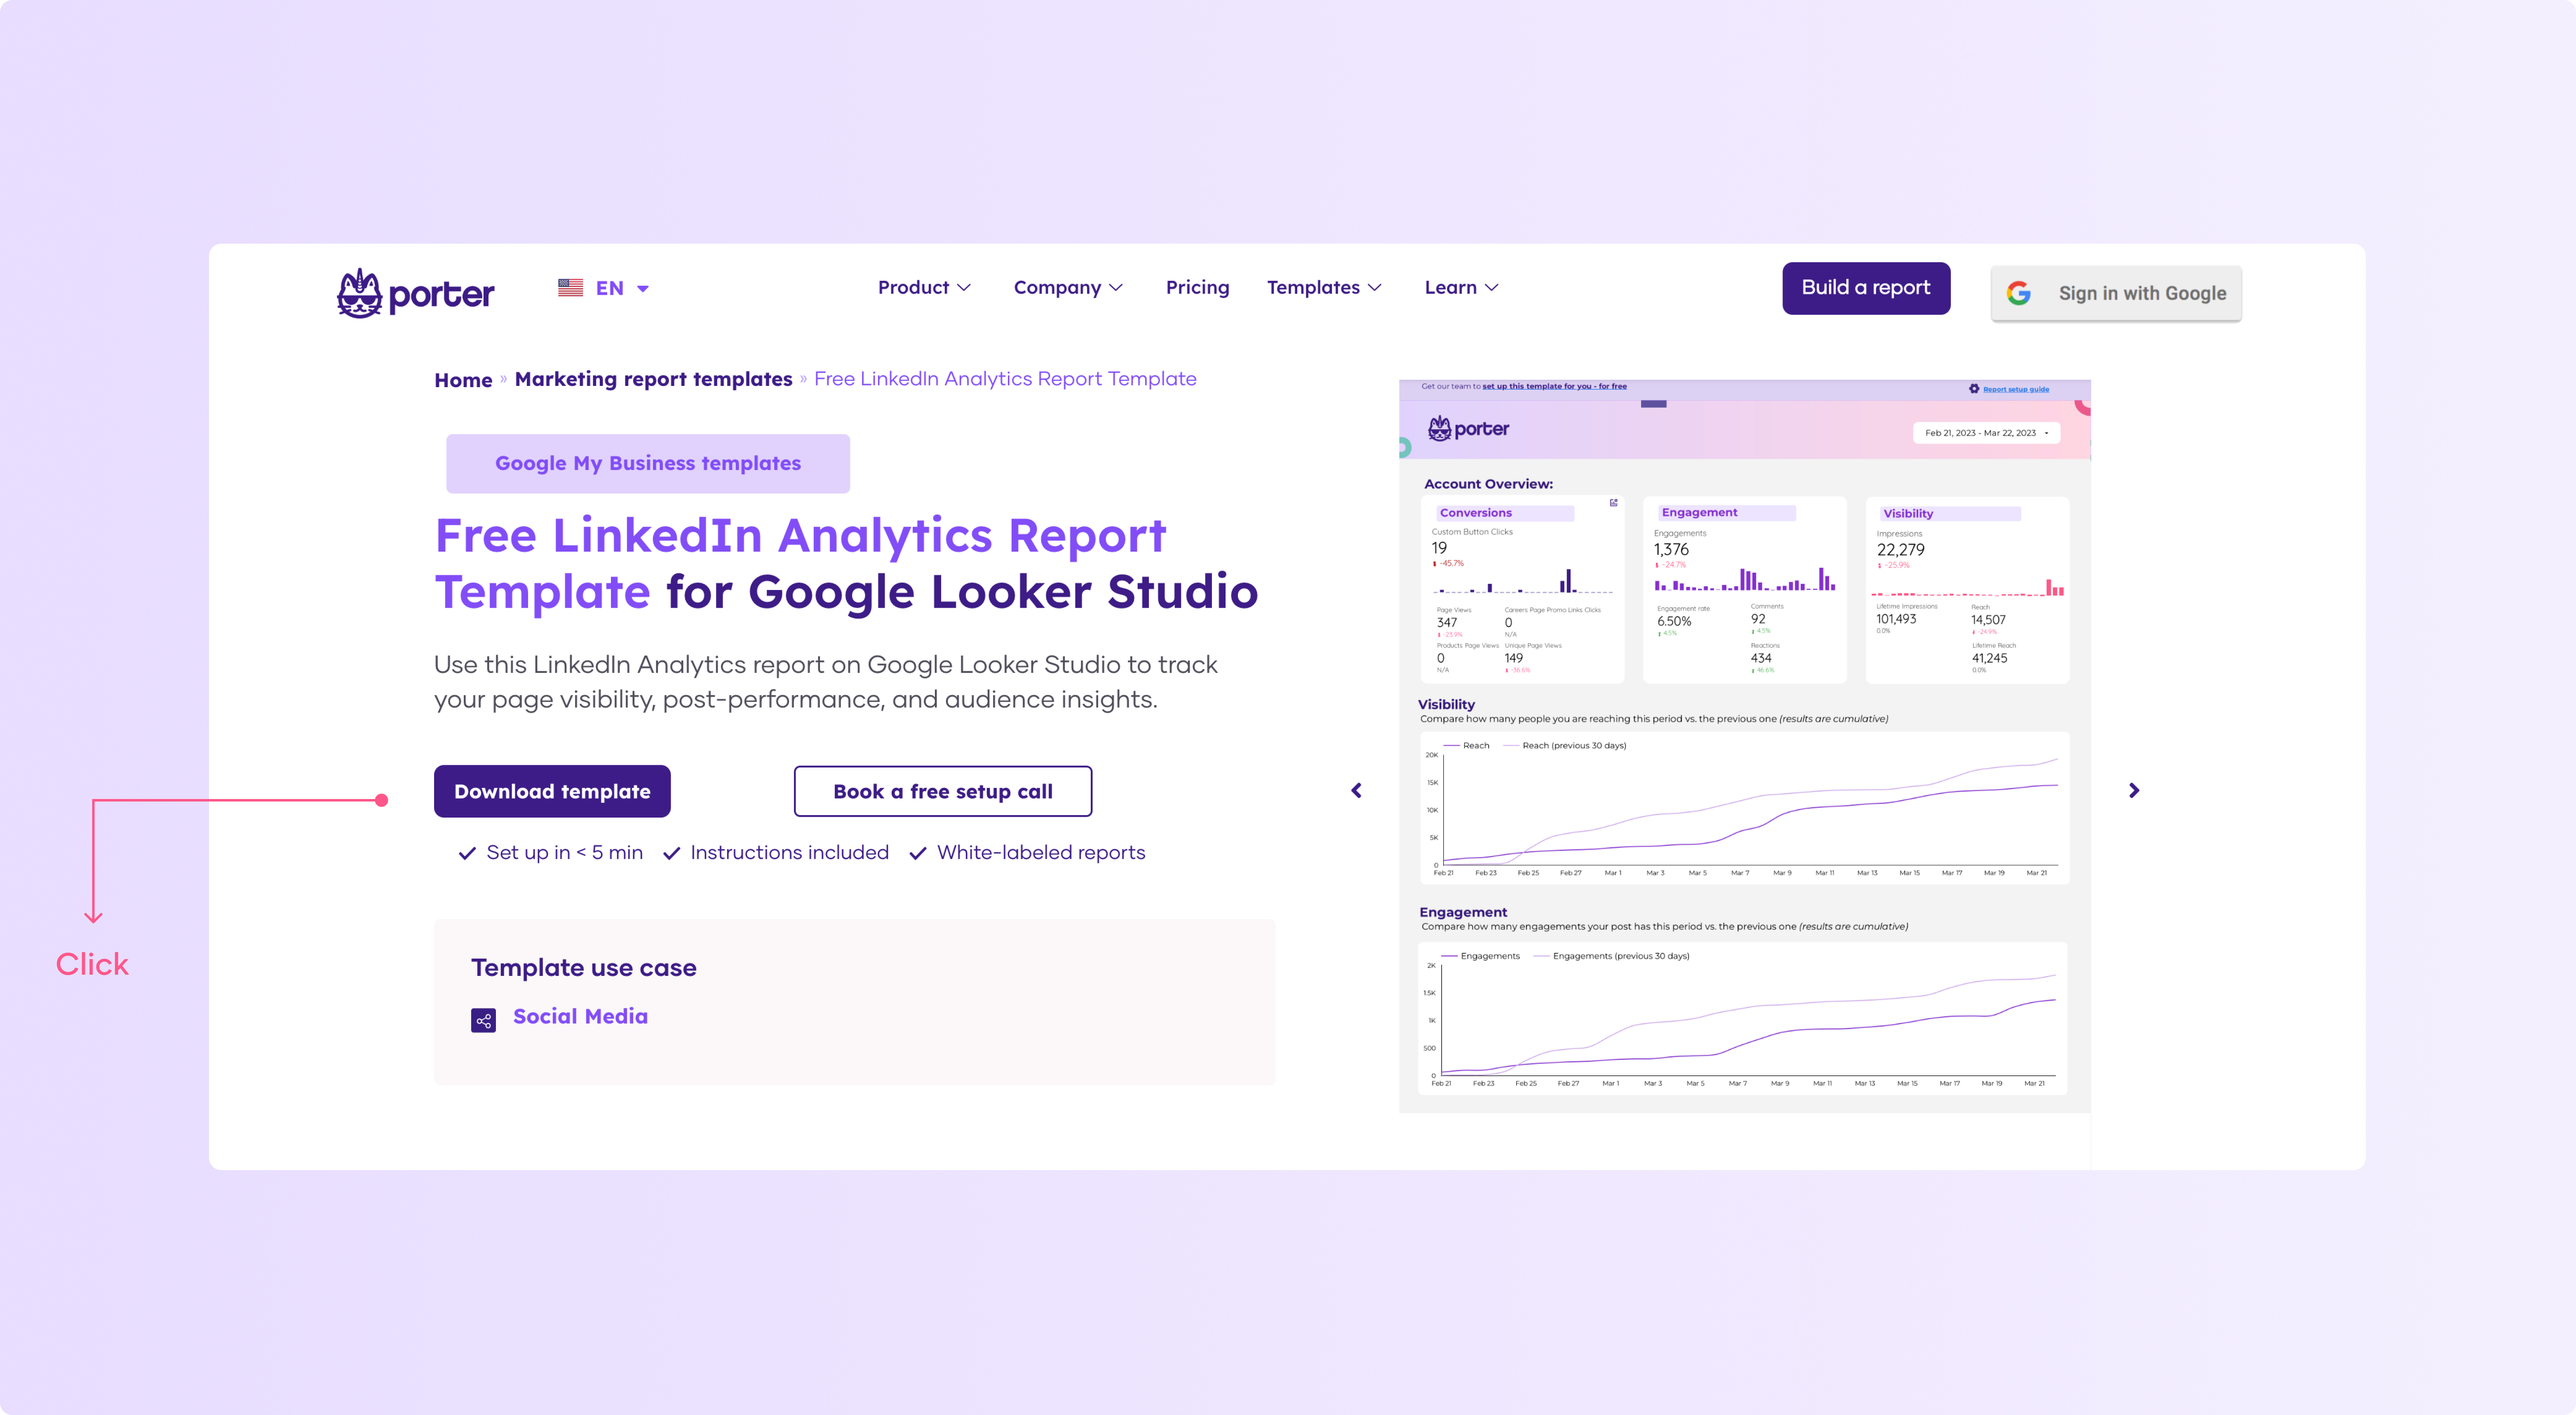
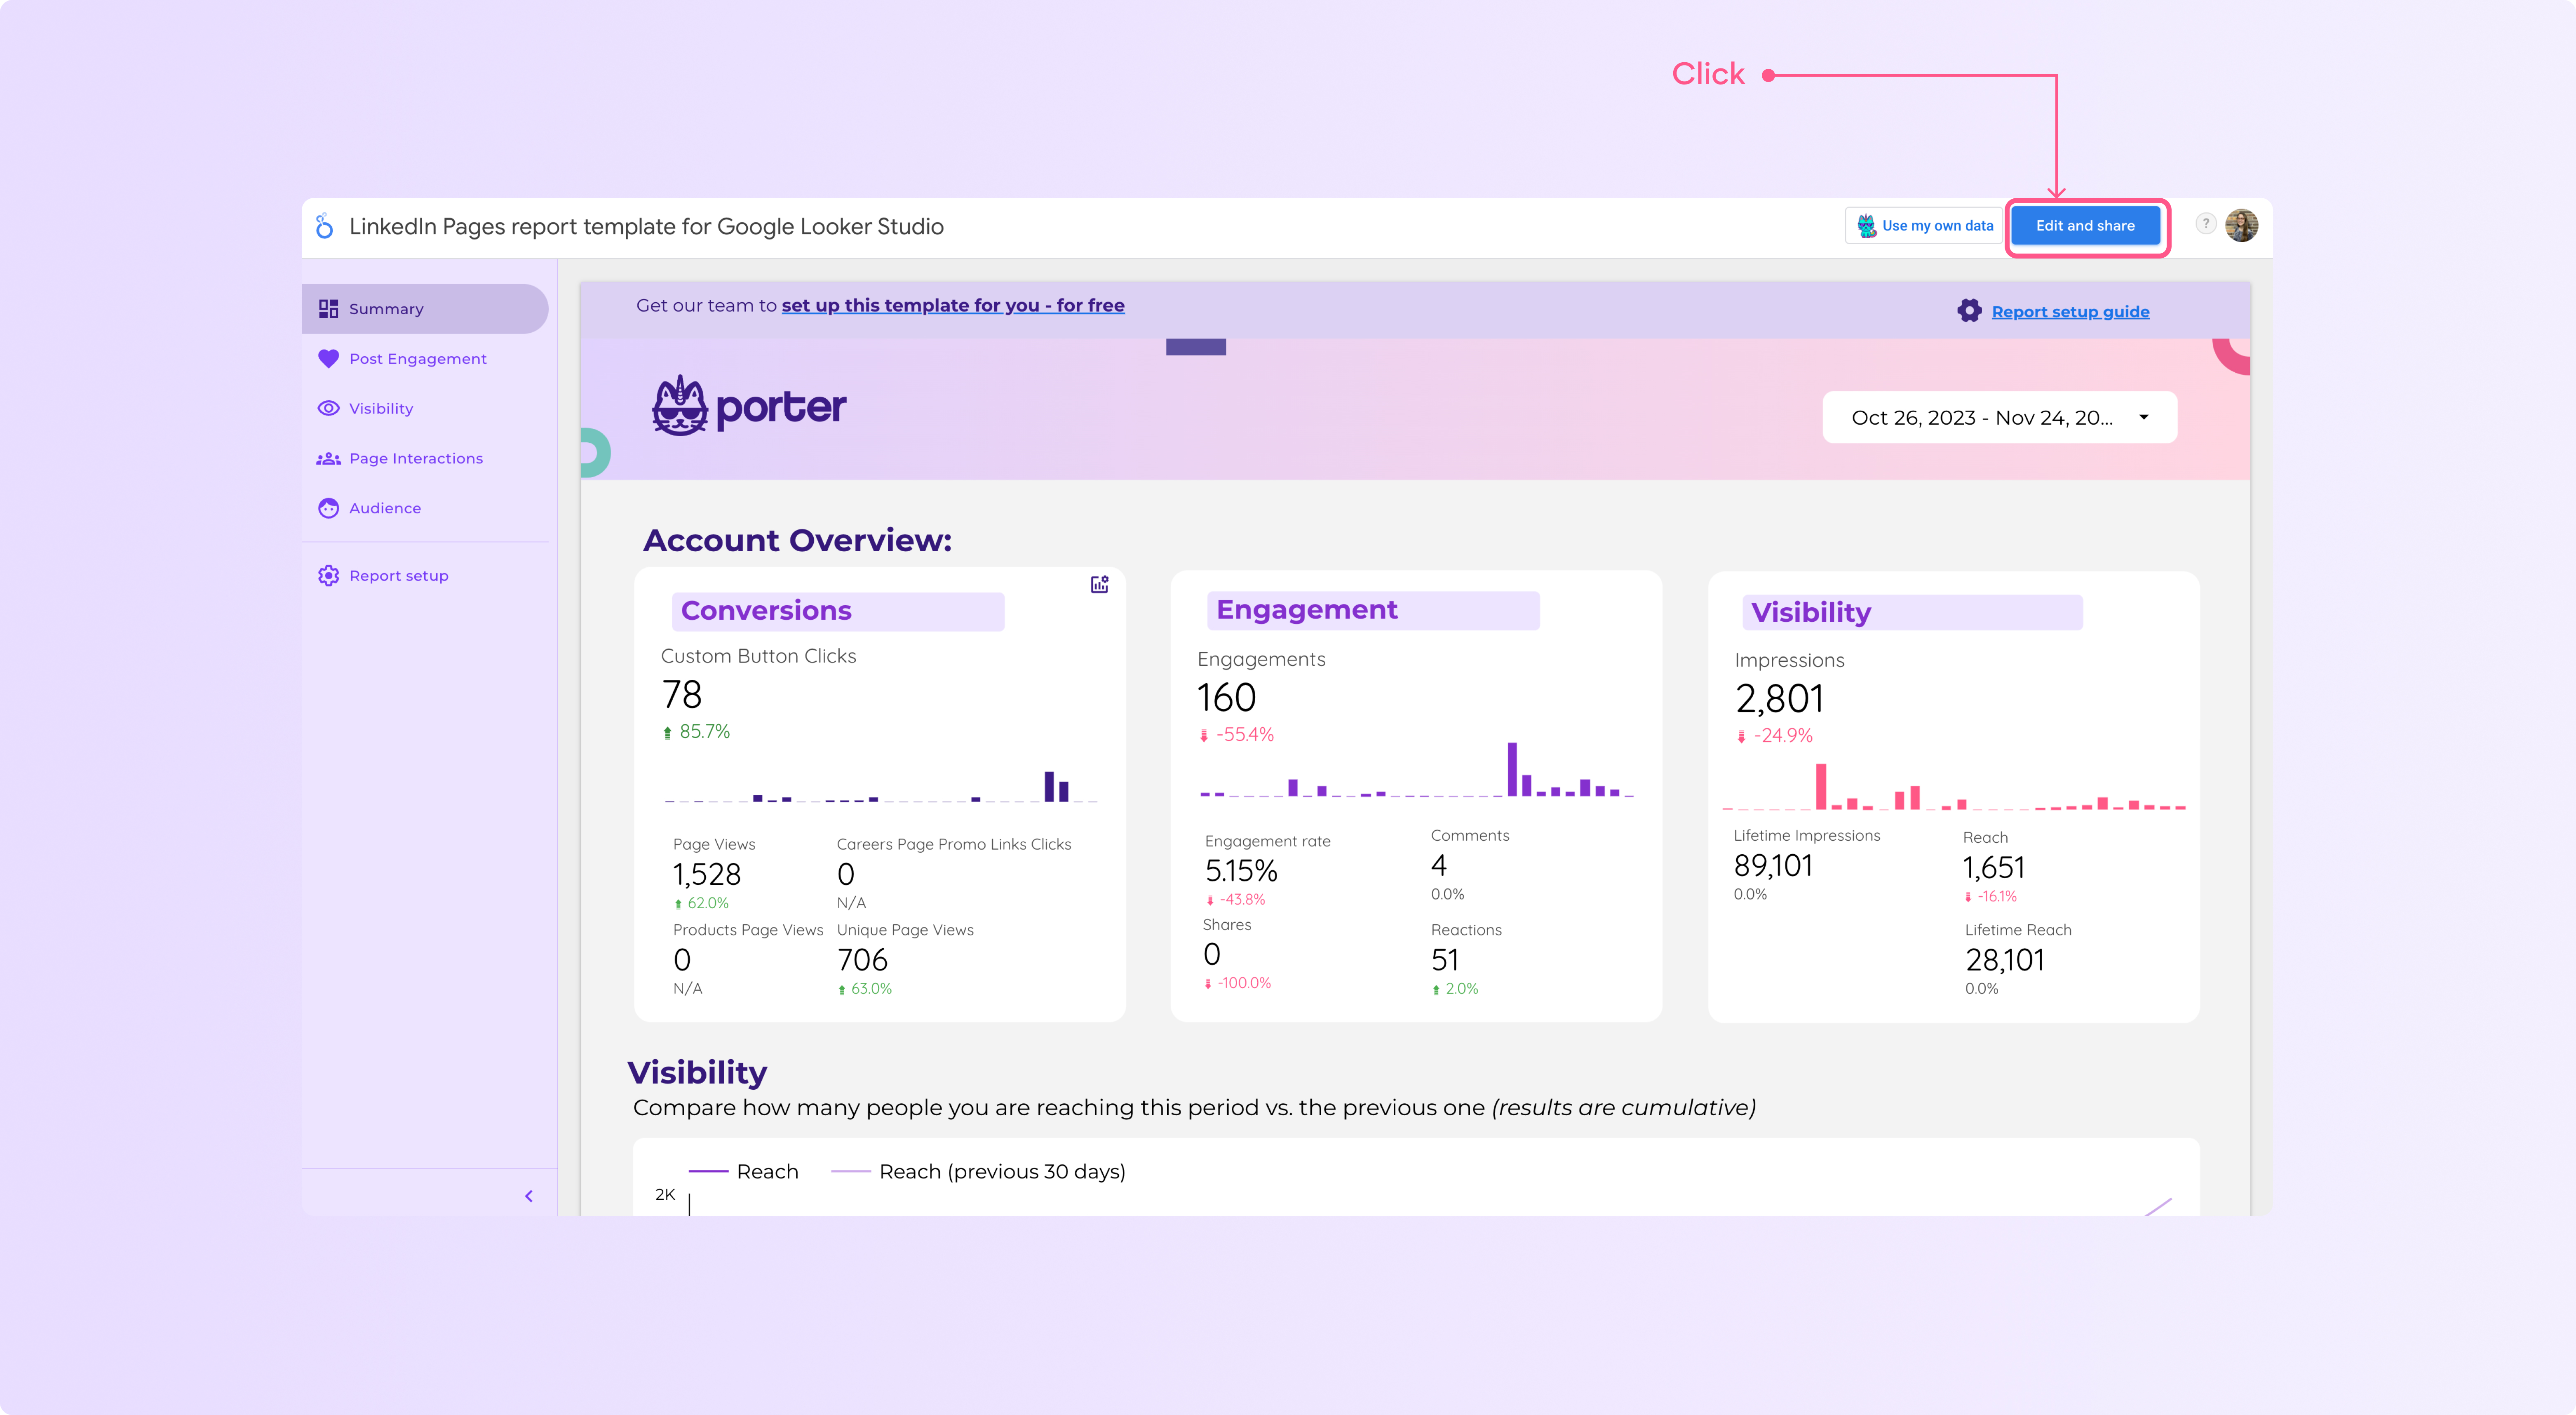
Access the downloaded template and click "Edit and Share"
Click "Add to Report" which will create a copied version of the template as a new report
The copied report will show up broken because it is not yet connected to your data
Go to Resources > Manage Data Sources
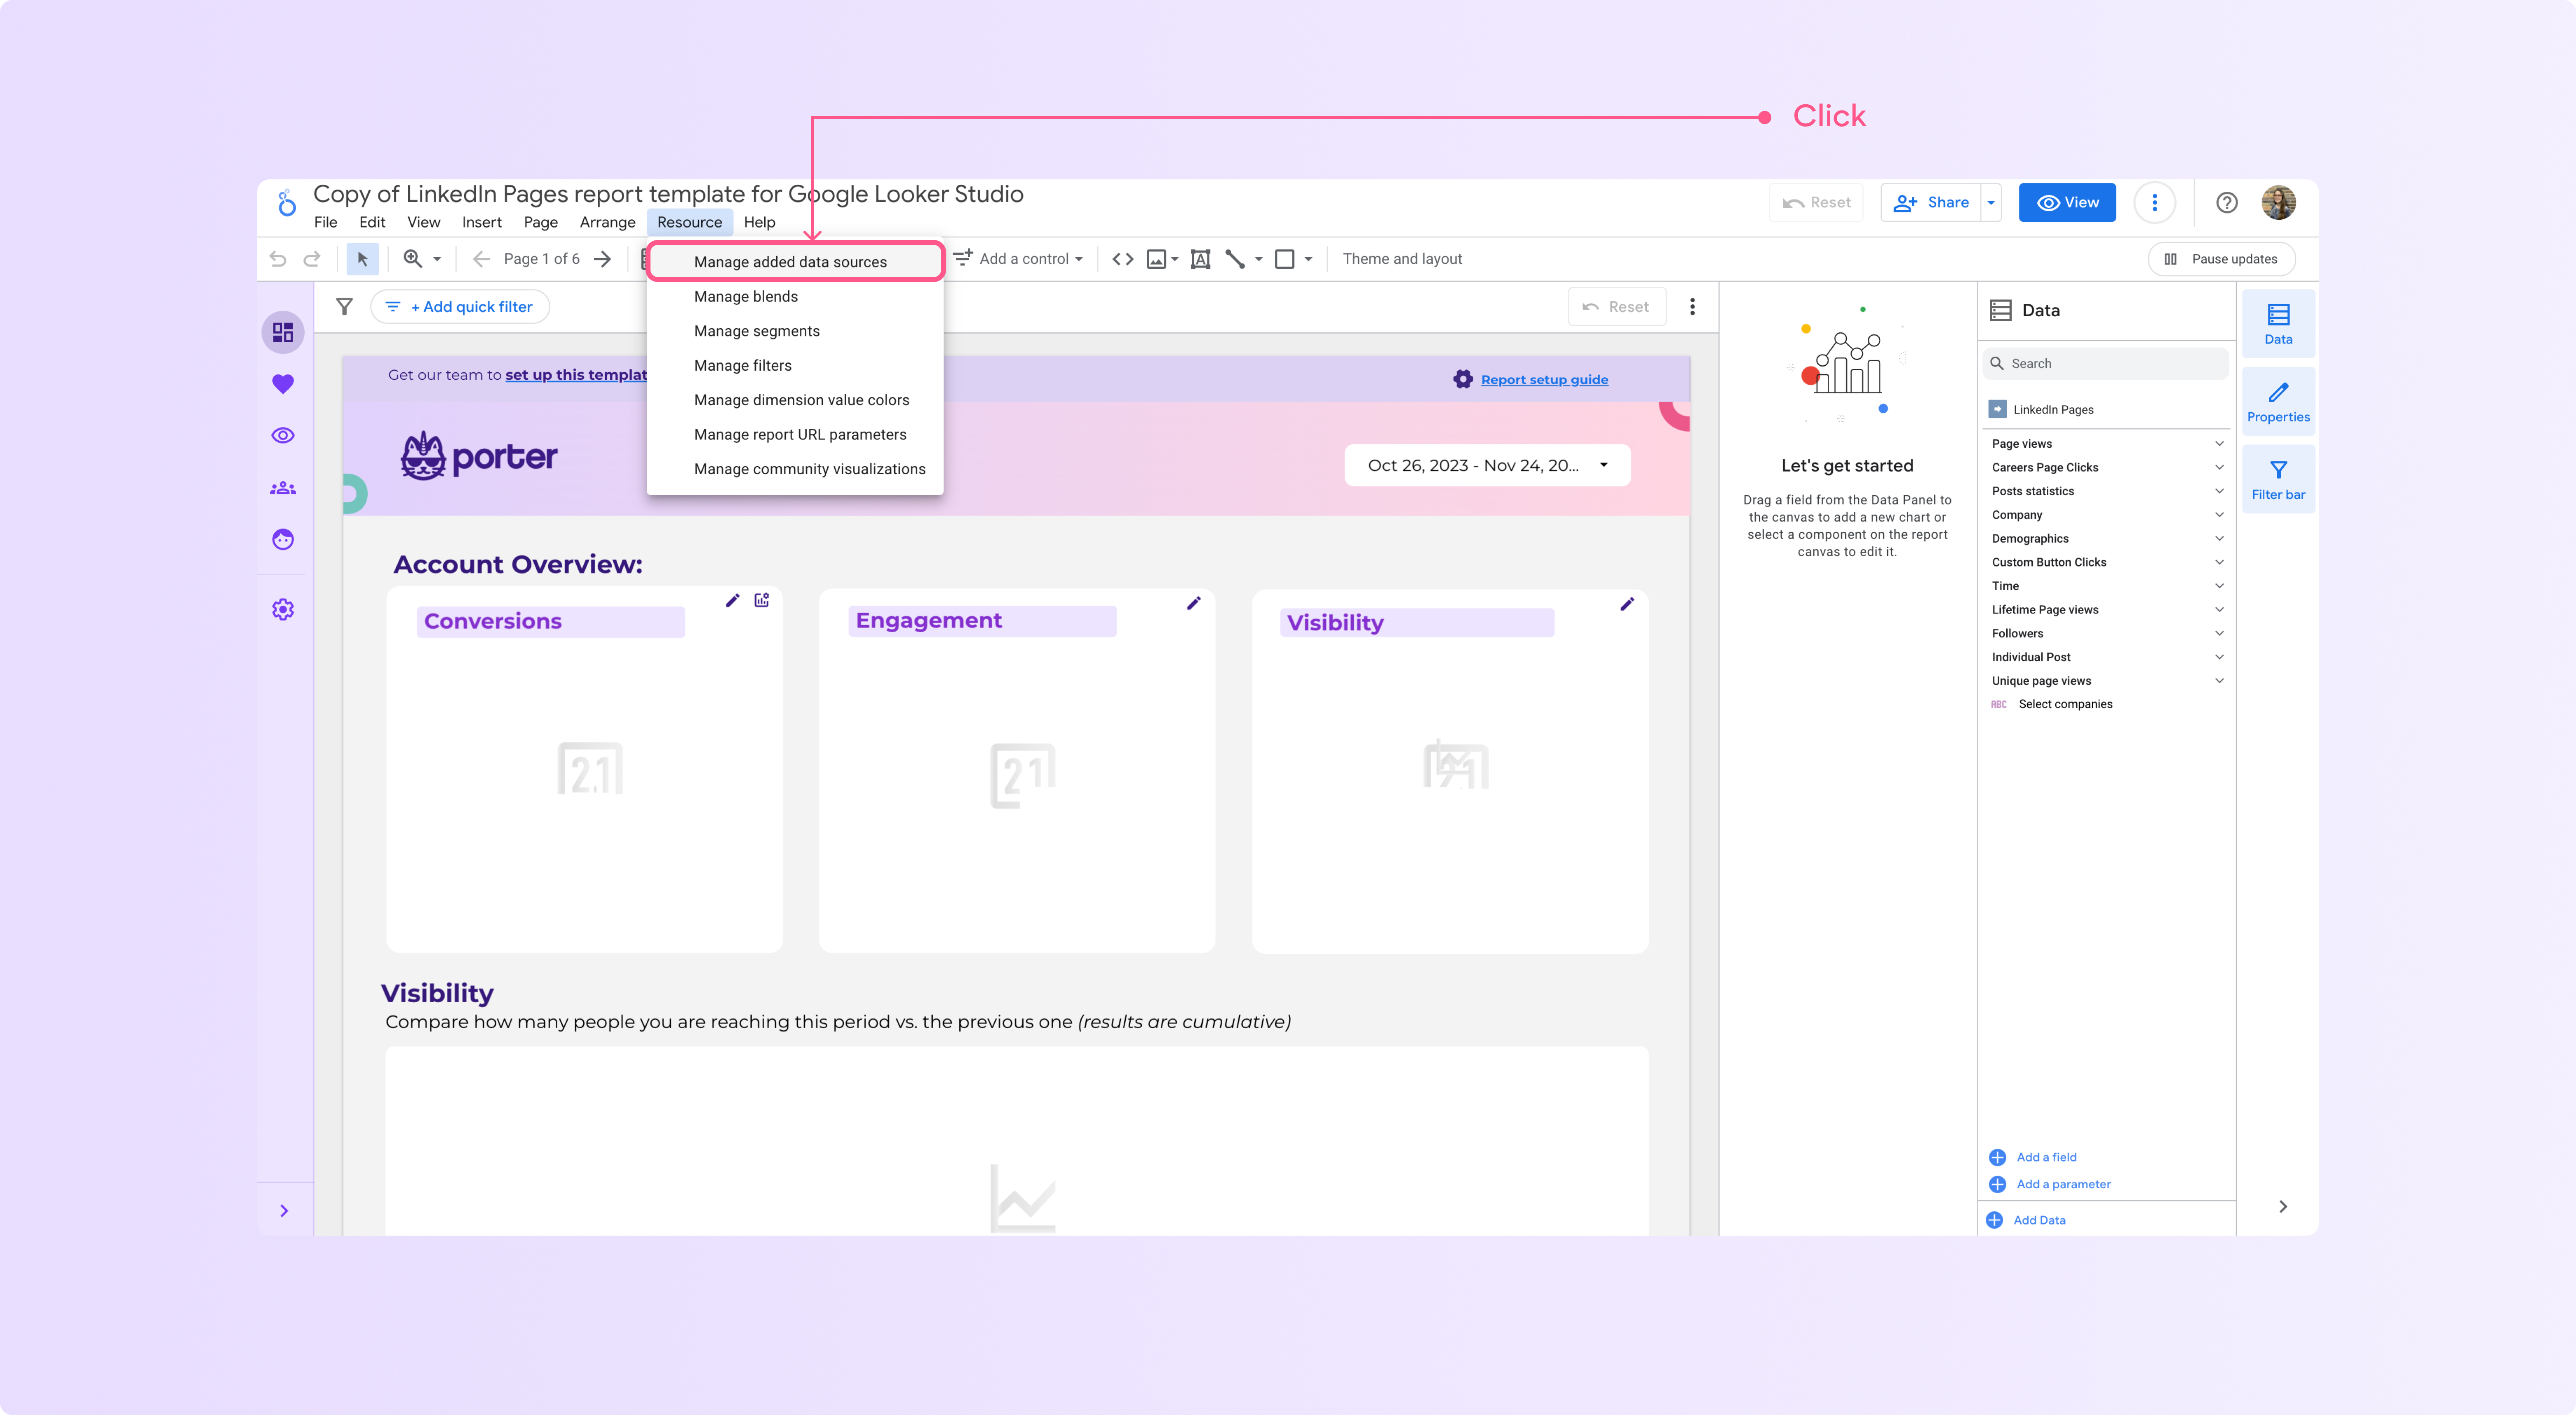
Edit the connection for your data source like LinkedIn Pages and authenticate/select account to connect your data
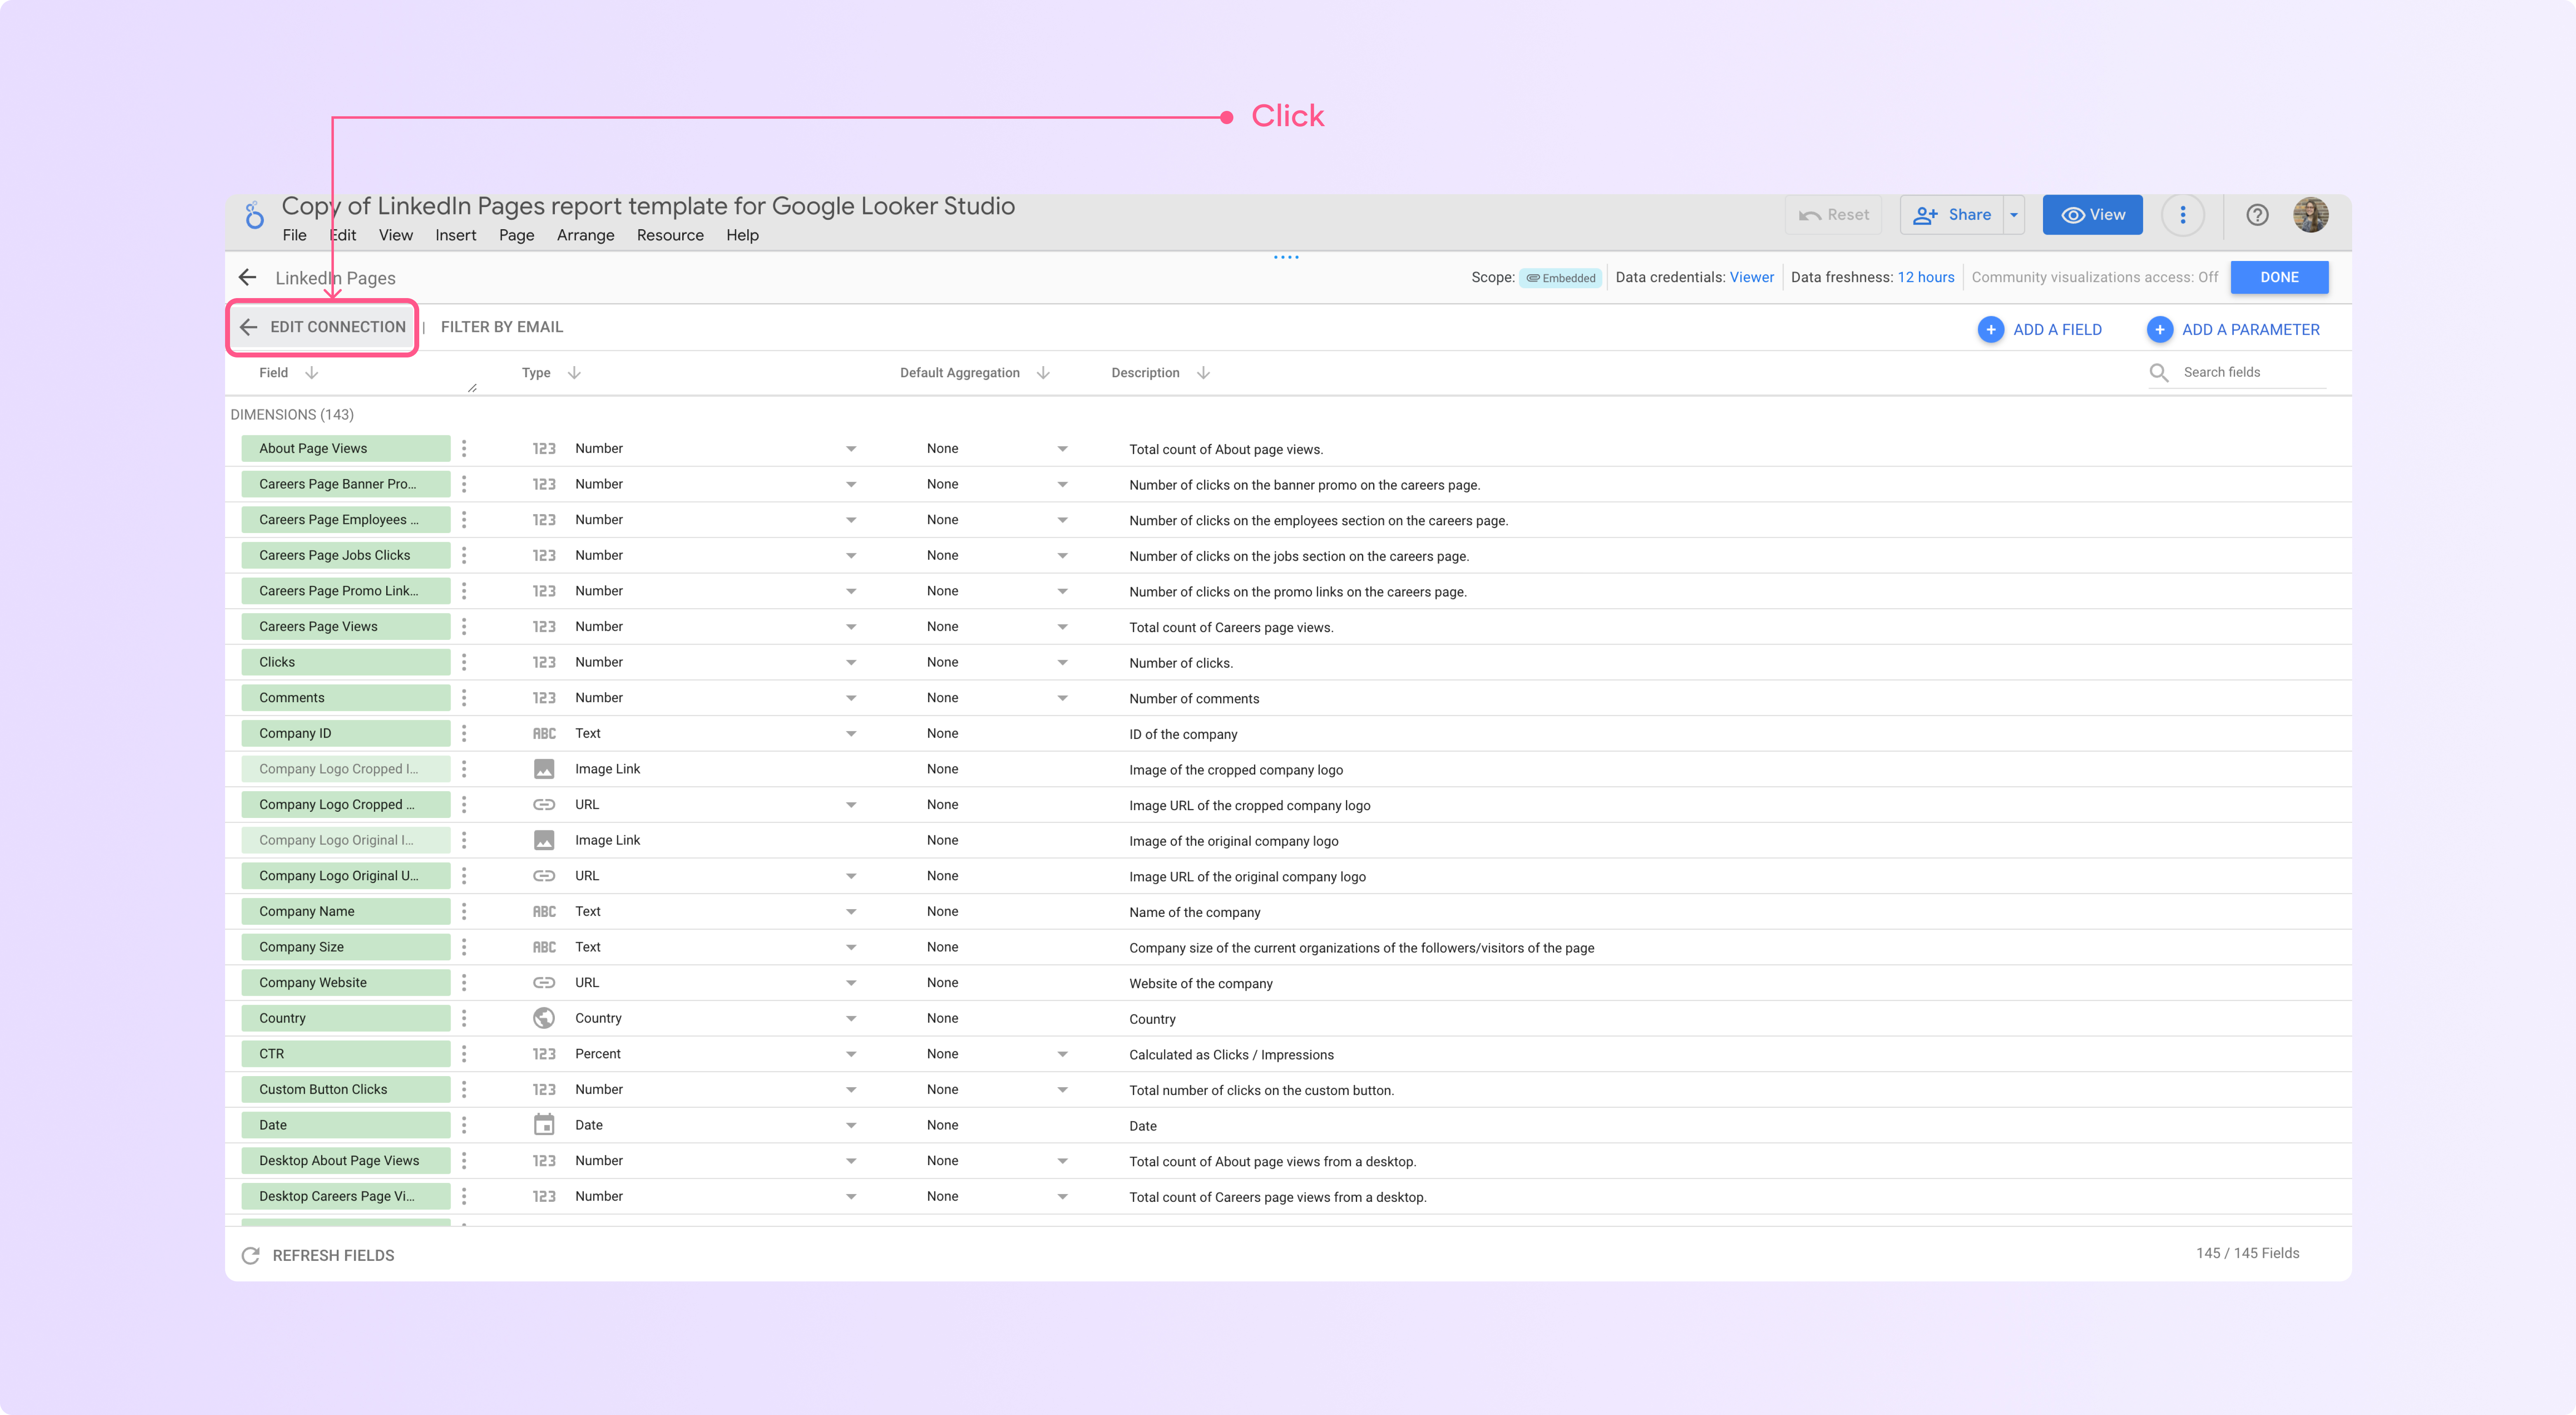
You will have to authorize your account with Porter Metrics and Looker Studio no matter the data source you are using
Click the link where it says 'add more accounts here', this will help you authorize for the first time but also changing your accounts in case you need it
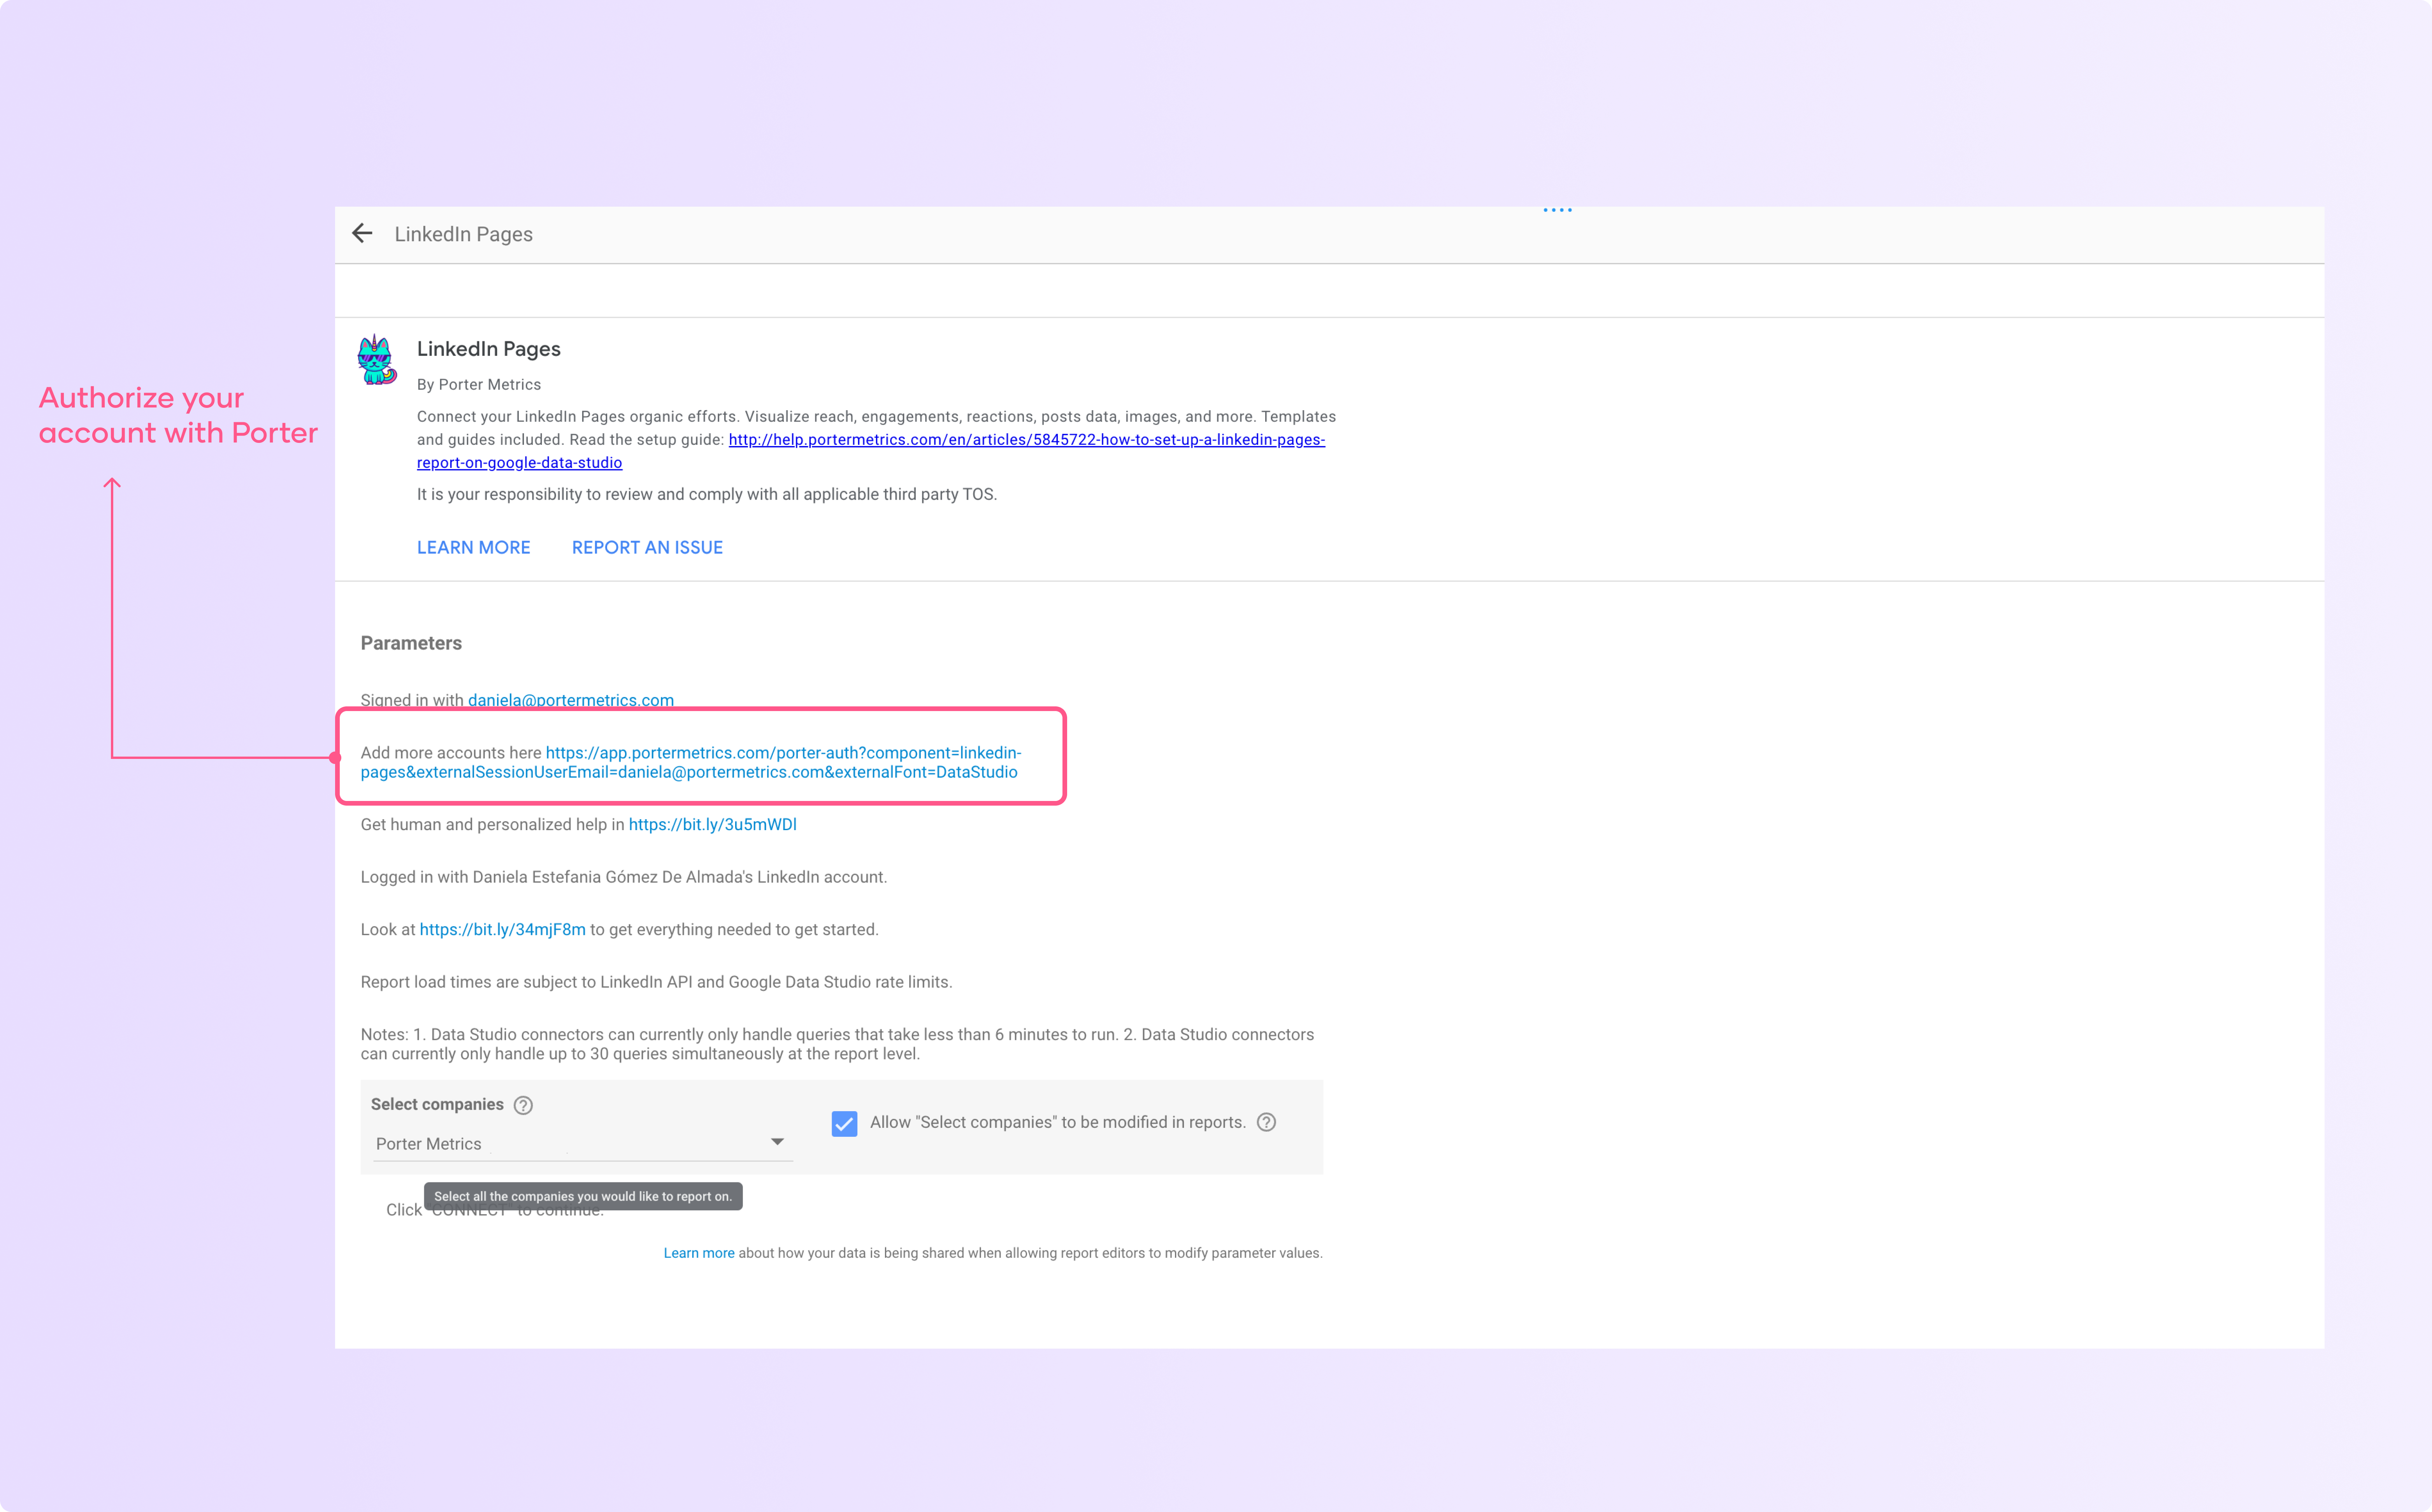
After authorizing your account, select the account or the accounts you want to include in the report by clicking the dropdown
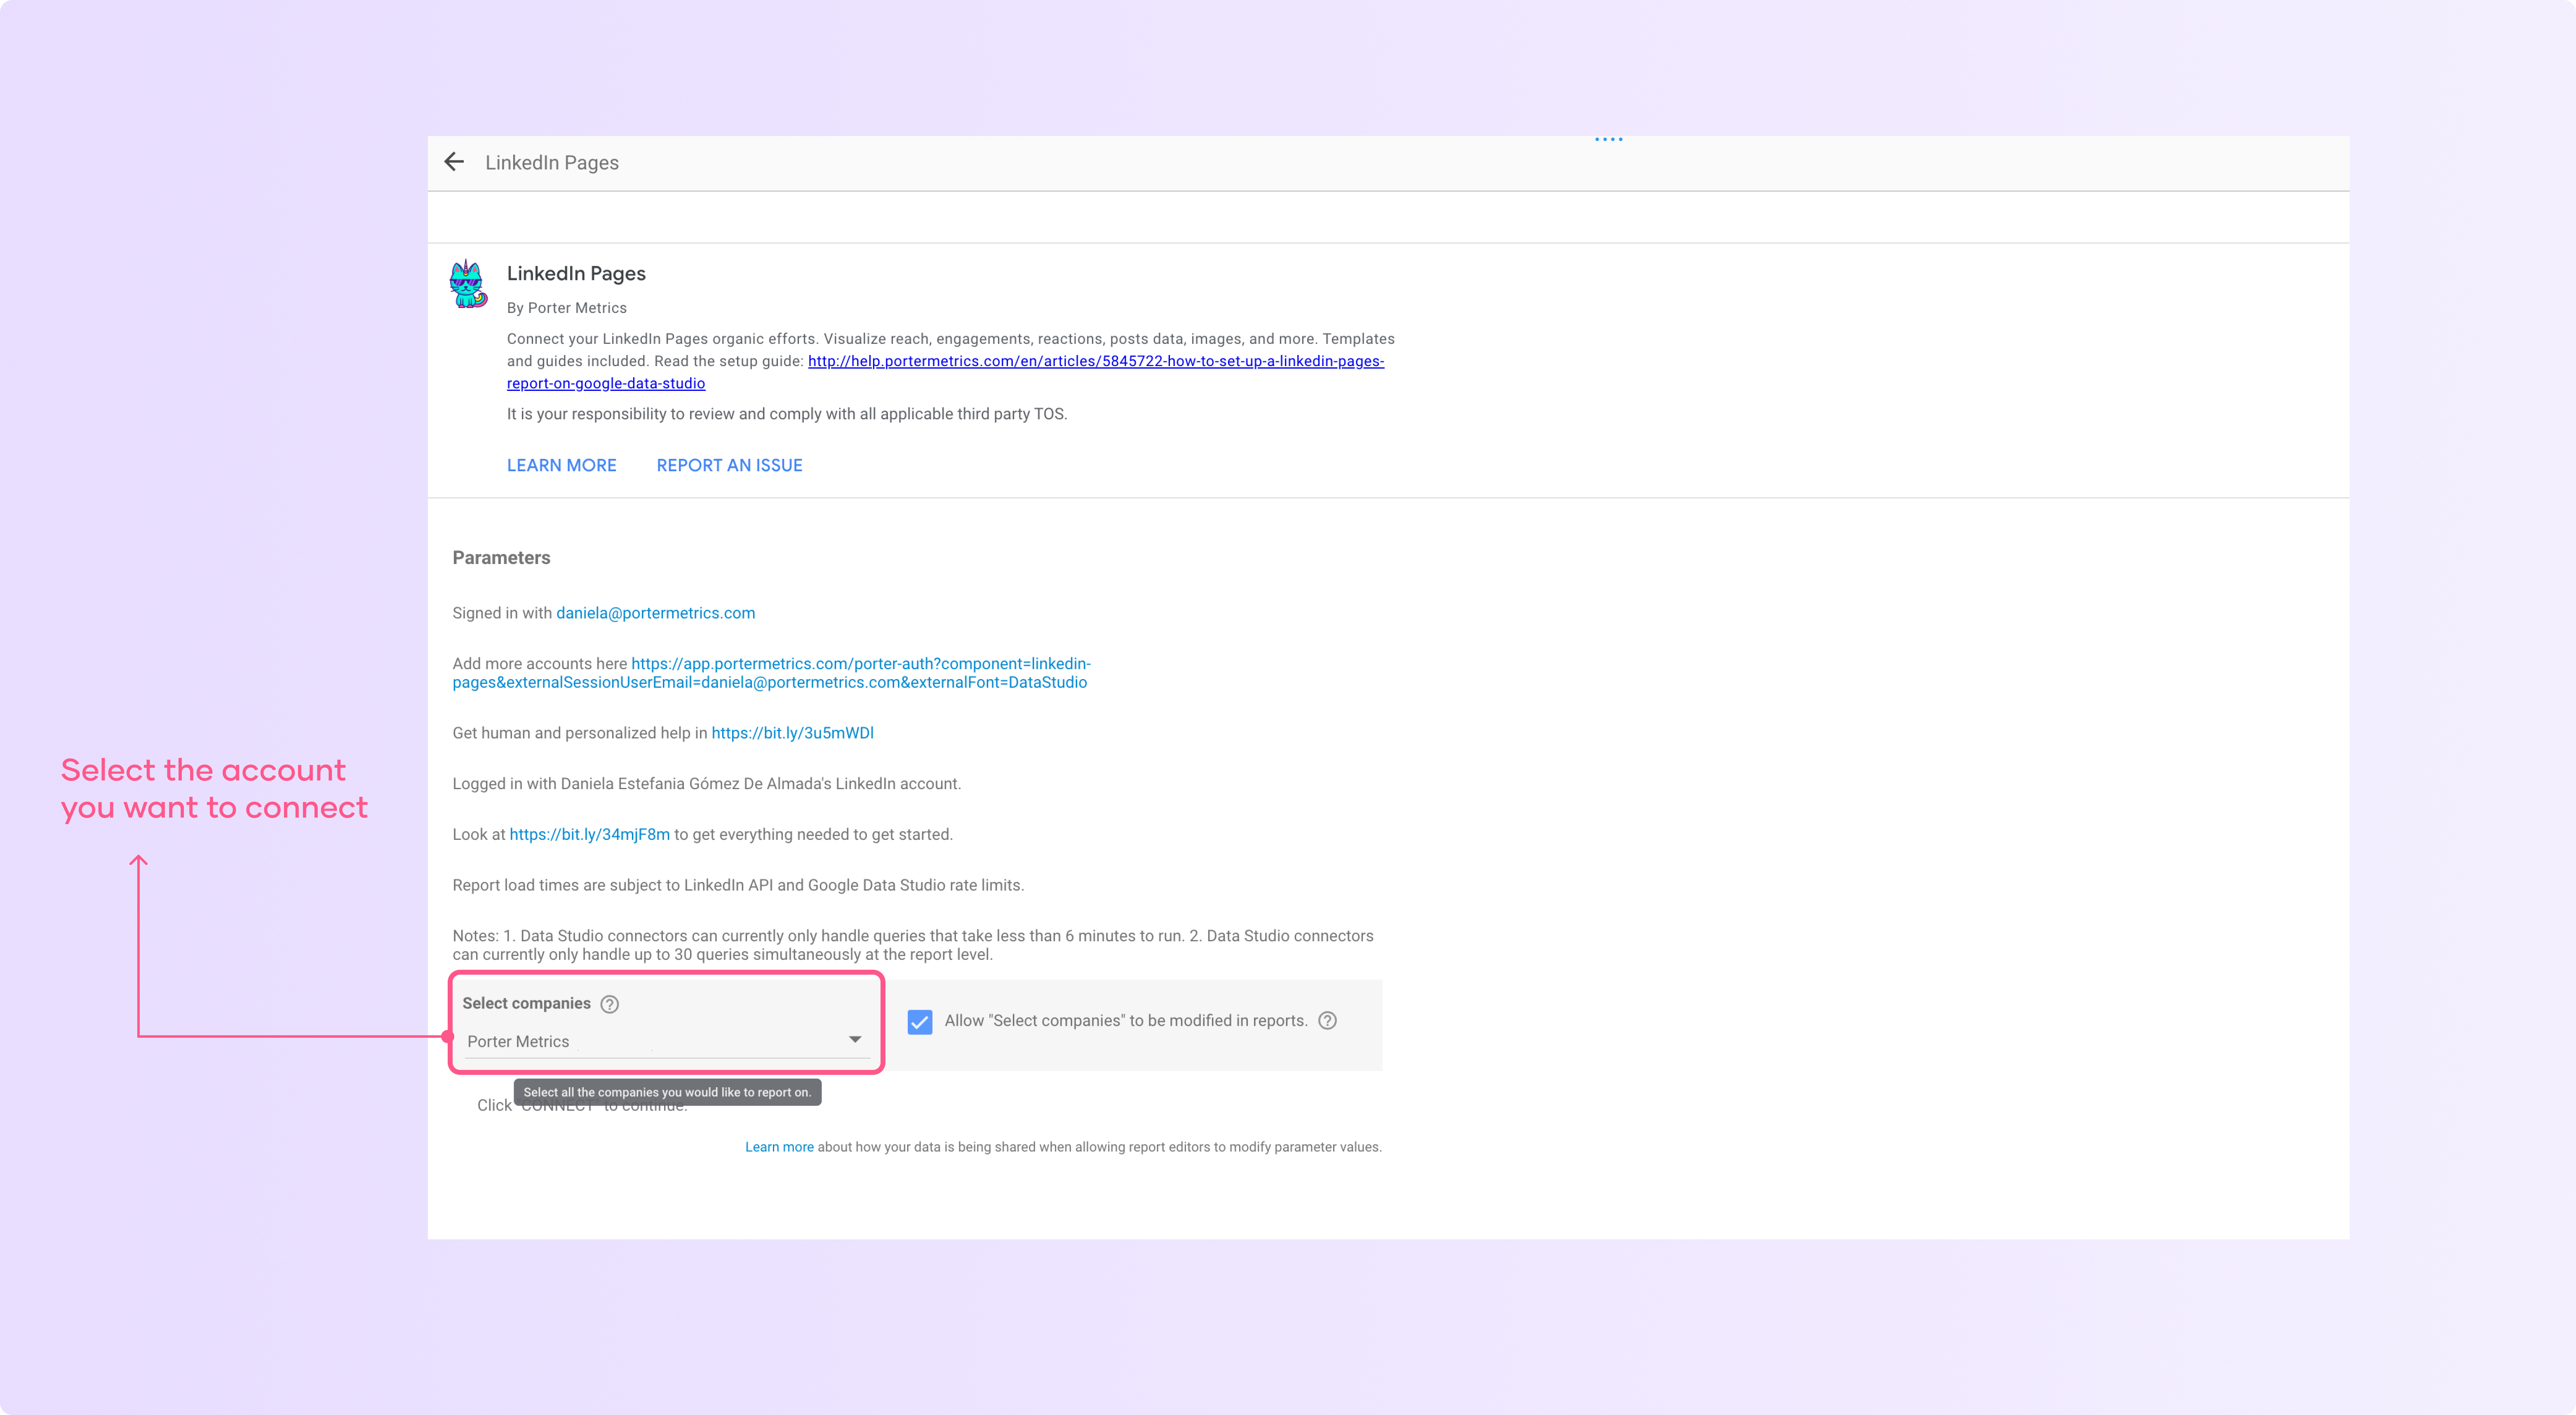
Now click on 'Reconnect' and this will take you to the list of fields included on the data source
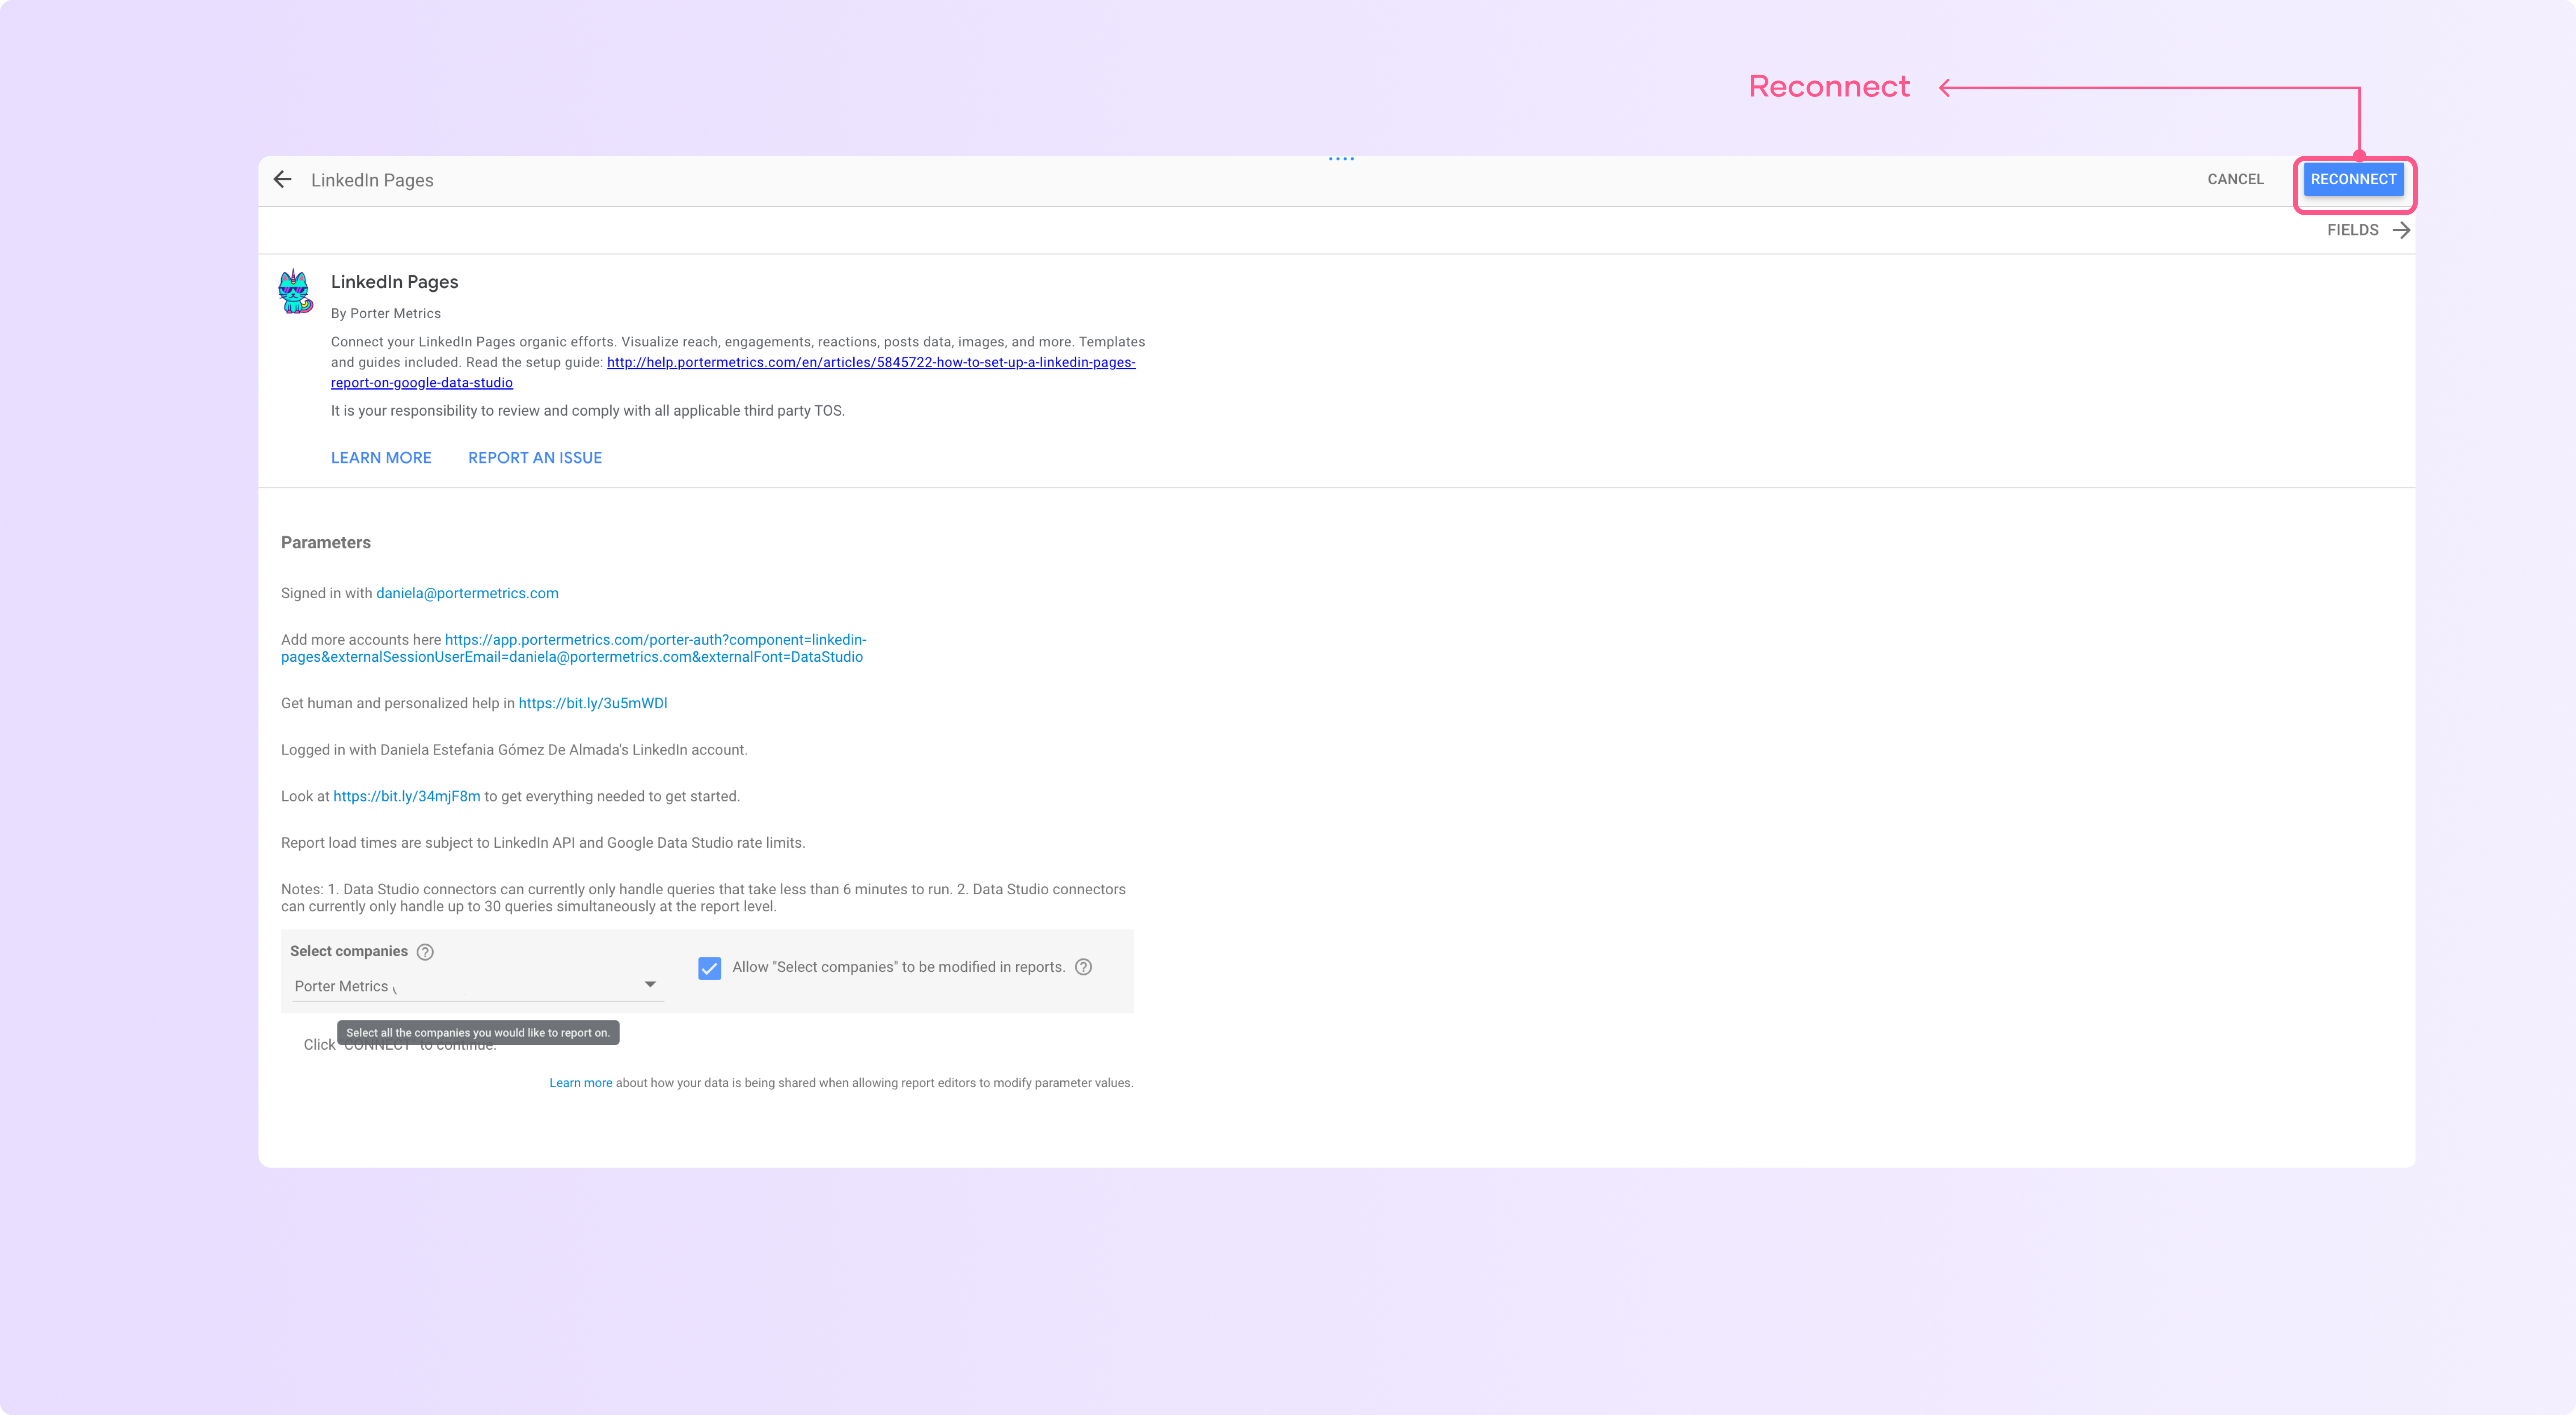
Tip when connecting paid media platforms, e-commerce platforms and social media platforms
Looker Studio automatically automatically disables the images, that means that if you have a table on the report with an image that is not enabled, your chart will break.
To avoid that, follow these steps:
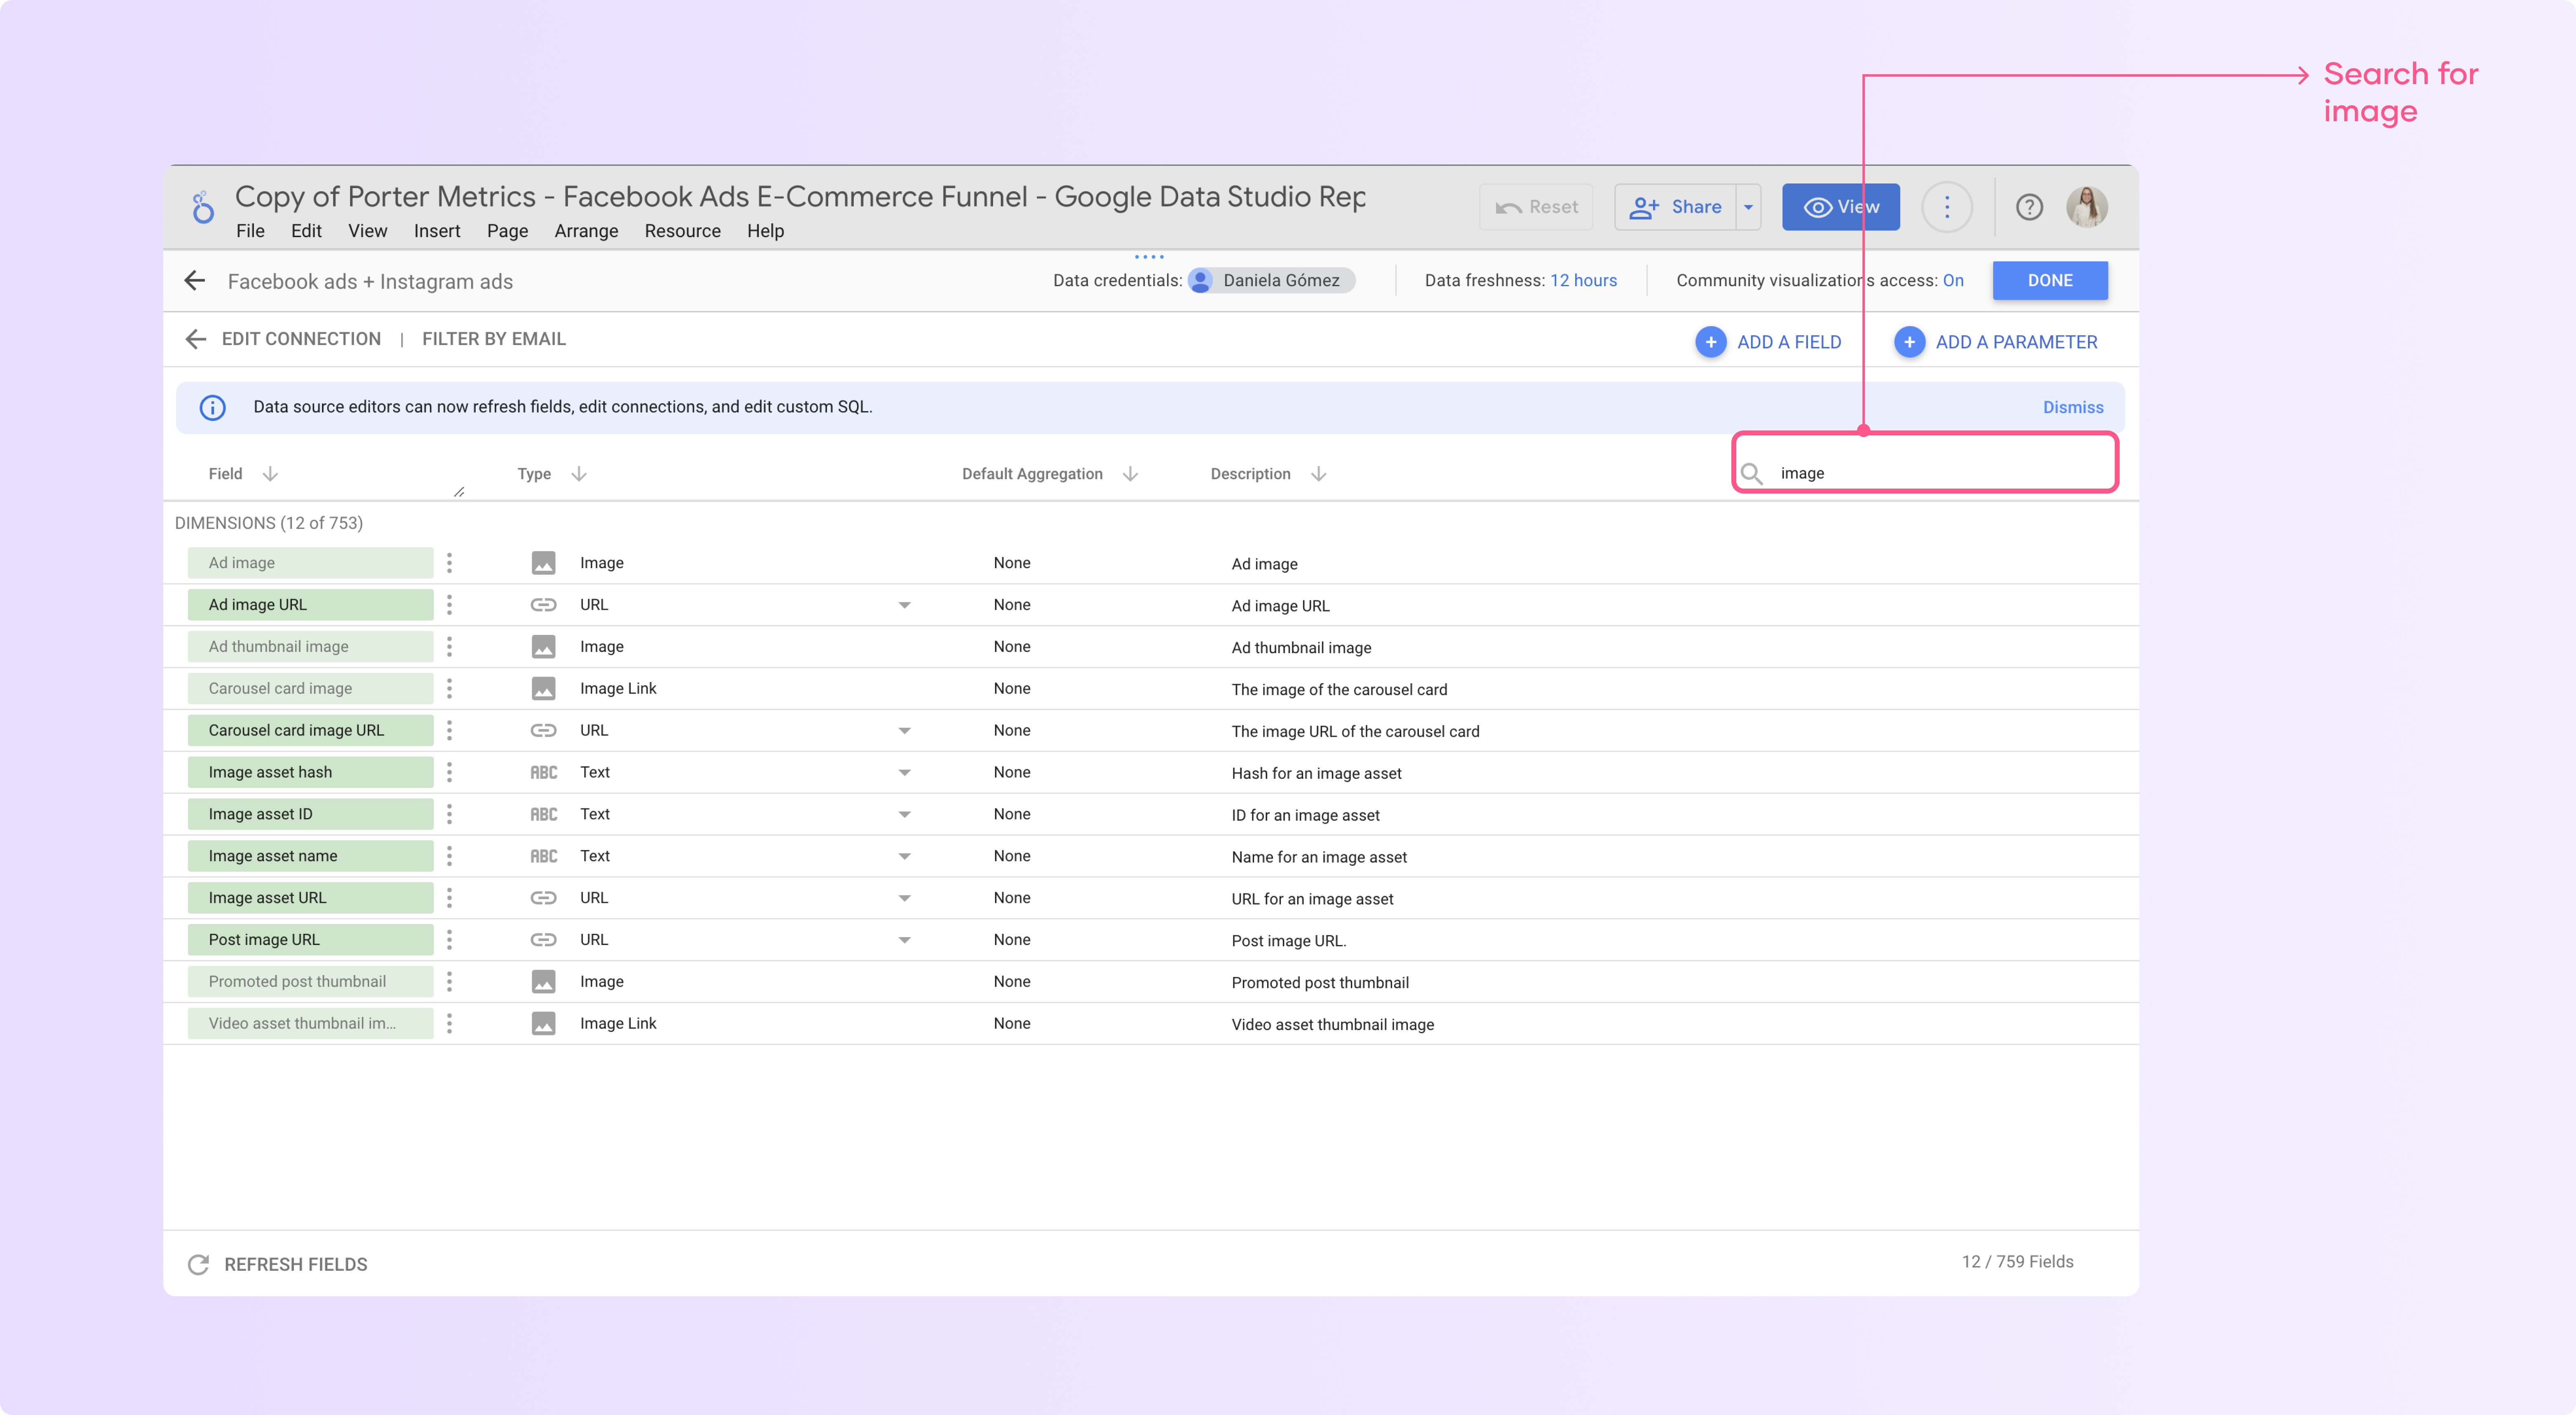
Search for the field image
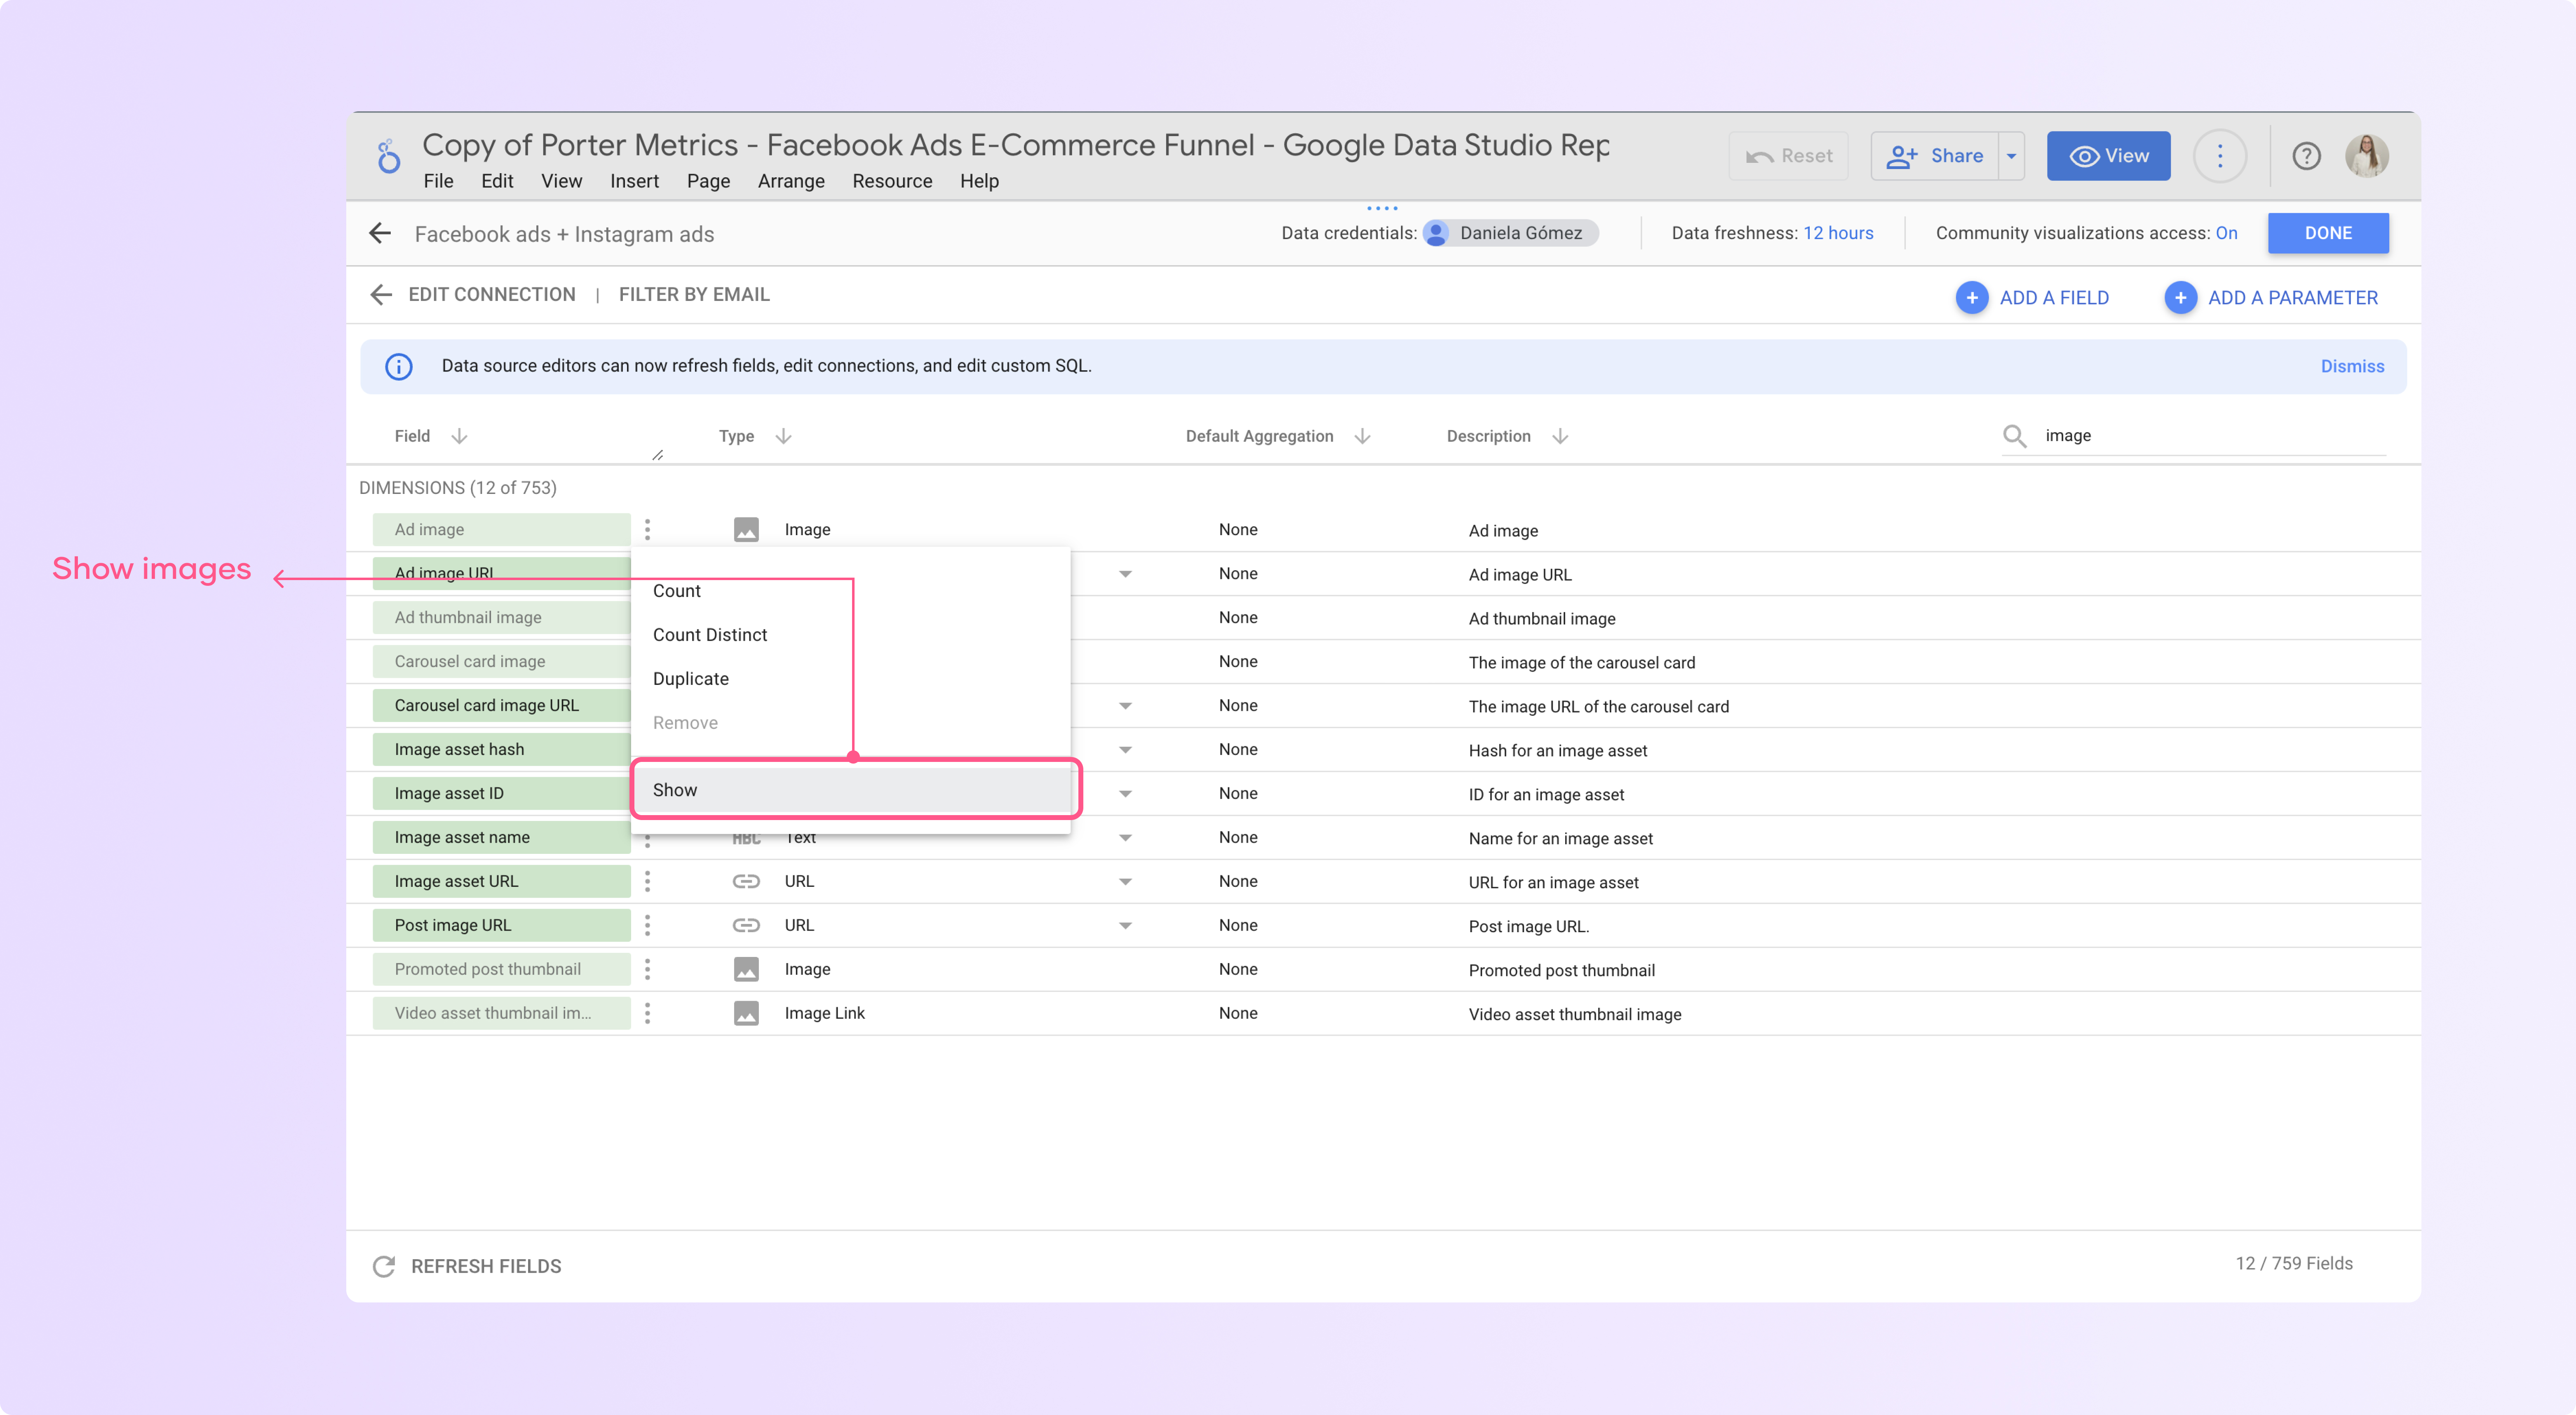
Now click on the three dots next to the field name and select 'Show'
Now click on 'Done' on the right corner and apply changes
Now your data should appear on your report but sometimes after connecting your data source, some of the copied charts may show errors or broken visualizations because they are referencing invalid metrics or dimensions.
To fix the broken charts:
Inspect each chart that shows an error indicator. The error message will indicate it cannot find a specified metric/dimension.
Edit the chart by selecting a new valid metric or dimension from your connected data source.
For example, replace an invalid "engagement_rate" metric with the actual "engagement_rate" metric from your LinkedIn Pages data.
Sometimes changes do not visually show up right away after replacing an invalid metric.
Refresh the entire report page by clicking the refresh icon at the top to force charts to redraw with the updated data.
Once you have a working copied template, you can reuse parts of it by stealing charts and elements into other reports.
Browse to the report template you want to take (steal) your charts from.
Select the specific visualizations, text boxes, images or other elements you want to reuse. To select multiple items at once hold the Shift or Ctrl key while selecting.
Copy the selected items to your clipboard with Ctrl+C or the copy button.
Paste the copied charts into your target report with Ctrl+V or paste button. You can paste them in empty space or right over an existing chart.
When pasting charts from another template, Looker will prompt you to confirm adding visualizations based on a new data source. Review the changes and click Confirm to finalize adding the copied charts with the referenced data source.
The same underlying data source will now be duplicated. You will see two connected sources even though they reference the same connection.
To clean this up, edit each pasted chart that you stole. Change the data source to use the existing instance you already had configured instead of the duplicated on