
There are 6 effective ways to fix data discrepancy issues in Facebook Insights on Looker Studio:
Combining metrics from different dimensions like posts, videos, and pages isn't allowed.
If you are missing data in your reports, you must request a back fill.
Understanding “Facebook Insights Connector”
The Facebook Insights connector for Looker Studio helps you analyze organic Facebook Page data.
It has over 300 data fields, including audience demographics, engagement metrics, post performance, and Messenger interactions.
Facebook often removes authorizations and permissions due to privacy measures.
It has separate “tables”; you can’t combine all the metrics among them.
Not all fields are available, lack historical data, or don’t match with the Facebook Pages Insights.
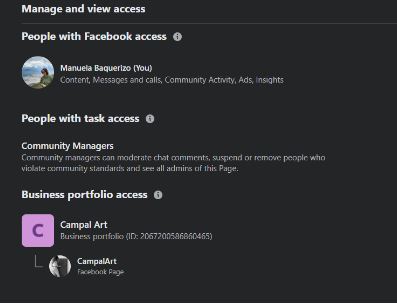
Disconnection, deauthorization, or missing permissions
Facebook tends to remove the authorization for privacy measures and you will find your report missing the data from the account you are trying to review. What could also happen is that the connector disconnects from the data source and you need to re-connect it.
If the data you're visualizing it's not the same as the one on your Facebook insights, make sure the account you connected is the same as the one you want to visualize. Also if the password of the business account was recently changed or permissions were wrongfully removed your reports will be affected and you won't be able to visualize the data.
Please be sure to review your permissions and roles in the business accounts you want to connect.
Page Reach doesn’t match
The reach metric is a tricky one, Facebook only gives it in specific time periods (1 day, 7 days, 15 days and 28 days), so when you ask for 20 days in our reports what we are going to do is give it the period closest to the date you are asking for. For example if you ask for the last 20 days we are going to give you the reach of the last 15 days.
What we recommend for you to use is IMPRESSIONS instead of reach. The impressions metric is the most accurate visualization metric, it's precise and without discrepancies. We also store this data for precision.
New followers historical data is missing
There are certain fields that do not have historical data, like new followers. The API only brings new followers from the last 28 days, so from the day you connect to Porter Metrics, we start storing your data so you can see past the 28 days mark, but remember this data will only get stored from the day you connect Facebook Insights to our connector.
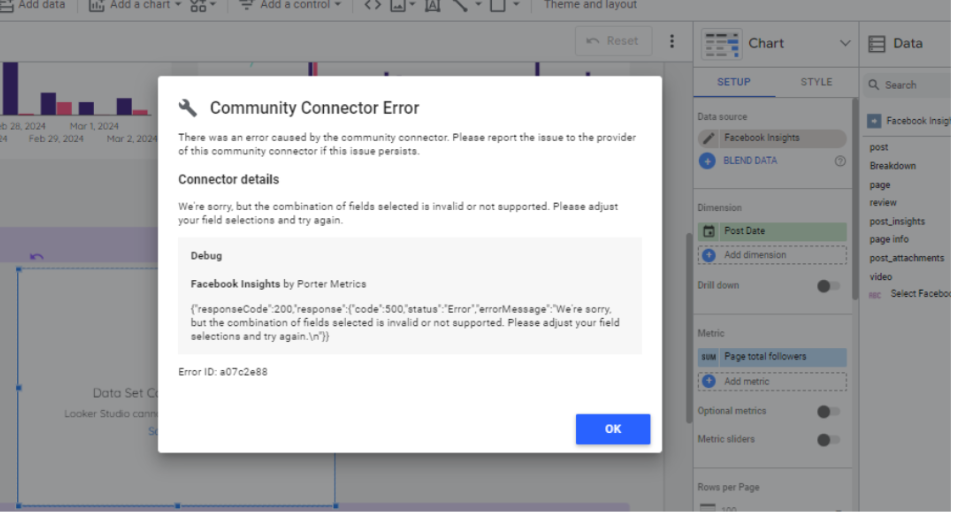
Combining posts, video, and page fields is not allowed
APIs work similarly to “Excel tables”, they provide access to various sets of data. When integrating data from different dimensions such as Posts, Videos, and Pages, each type of data is like a separate “table” with its own fields (metrics). Combining these dimensions into a single “table” for comparison will give a “community connector error” because the metrics (e.g., likes, followers, video views) are specific to each type of dimension and aren't comparable. For example, a post will have likes and comments, a page would have followers, while a video will have 3 sec views.
What are we doing to fix this?
We are going to allow the combination of metrics by universal dimensions like (dates or account name), this way you are going to be able to see how many new followers you gain on a certain date when you created a new post. This implementation will allow you to compare different metrics in a single table that is governed by an universal dimension.
Demographics
Facebook recently changed its privacy policy so you won't be able to visualize certain demographic data, for instance let's say you want to see impressions by gender and age, Facebook won't allow it. The only demographic data Facebook is allowing as of this moment is the following: Country, Gender, Age at Page Followers level. The same is happening in other social media pages like: LinkedIn and Instagram.
Facebook Insights Updates
Missing Data
Another not so common error is when your report is missing data. This can happen because Facebook did not collect data for a period of time or it didn't send the information through the API to our connector. So if you create a time series graph with reach and see that you have data holes, you know that your report is having a missing data issue.
In this case you will have to report this to us and request a backfill
https://app.supademo.com/demo/cltq9hzw5029dvnjwgs9m0413